The Response Metrics MTTA (Mean Time to Acknowledge) and MTTR (Mean Time to Resolve) Report tells the story of your investment in Splunk On-Call and the practice of DevOps. Track evolution and goals over time, and tell key stakeholders the story by relaying key metrics directly related to the cost of downtime.
Navigate to Reports >> Response Metrics
Response Metrics Graph View
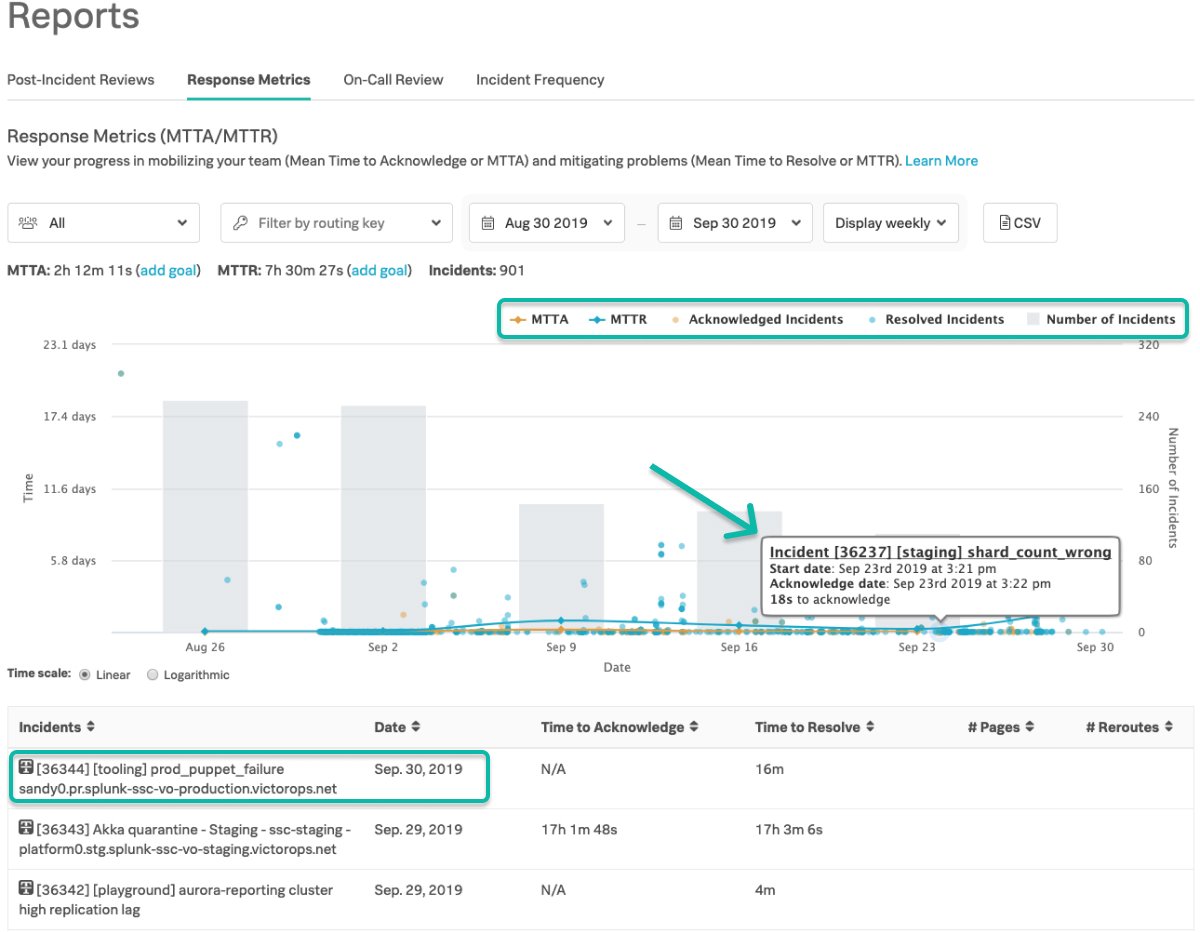
By default, the MTTA and MTTR lines will be displayed in the graph view if incidents are present in a specific time period. Incidents are displayed in vertical columns to relay the aggregated incident number in a specific timeframe, while also displaying the individual incidents making up the time range.
Select and deselect items in the Graph key to include the data points that are important to you.
- Hover over an incident to learn key metrics, and click an individual incident to get the granular information surrounding a specific data point. For the bucket averages, only the hover state is available.
- Select individual incidents to drill into more granular incident data.
- Select and deselect items in the Graph Key to include the data points that are important to you.
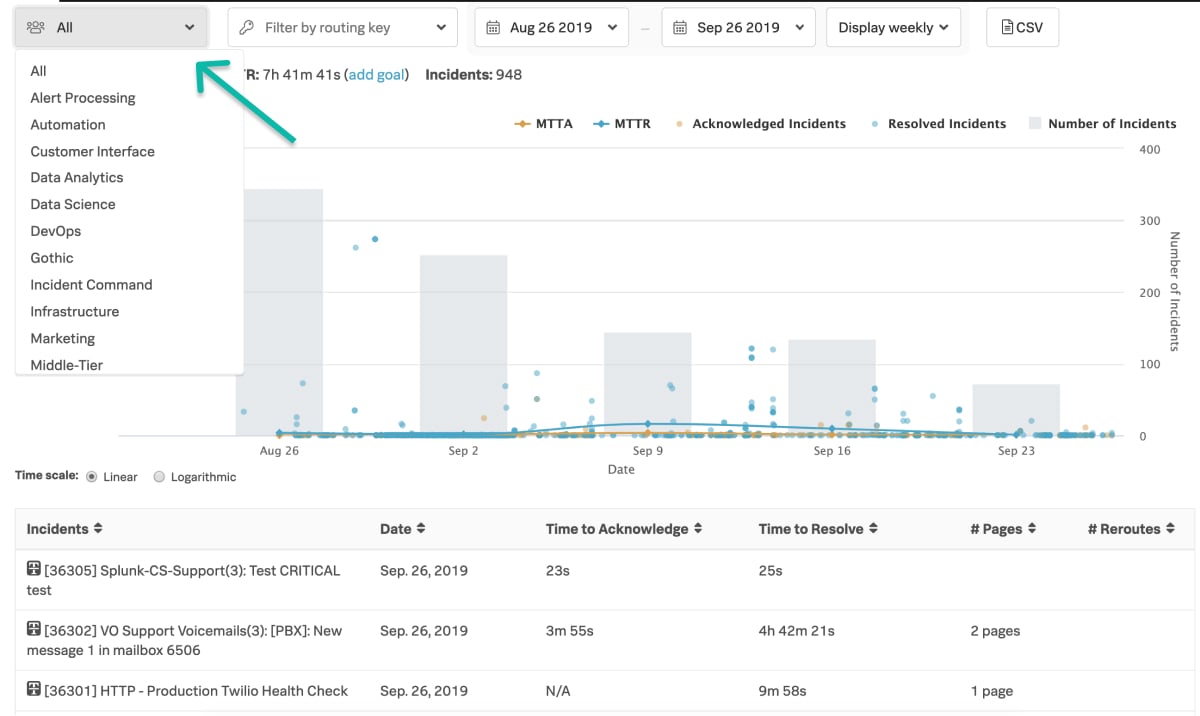
Track Response Metrics with Team Filtering
Track both your organization and team’s MTTA/MTTR and incident metrics by leveraging the team filter. These are directly related to the associated team’s escalation policies.
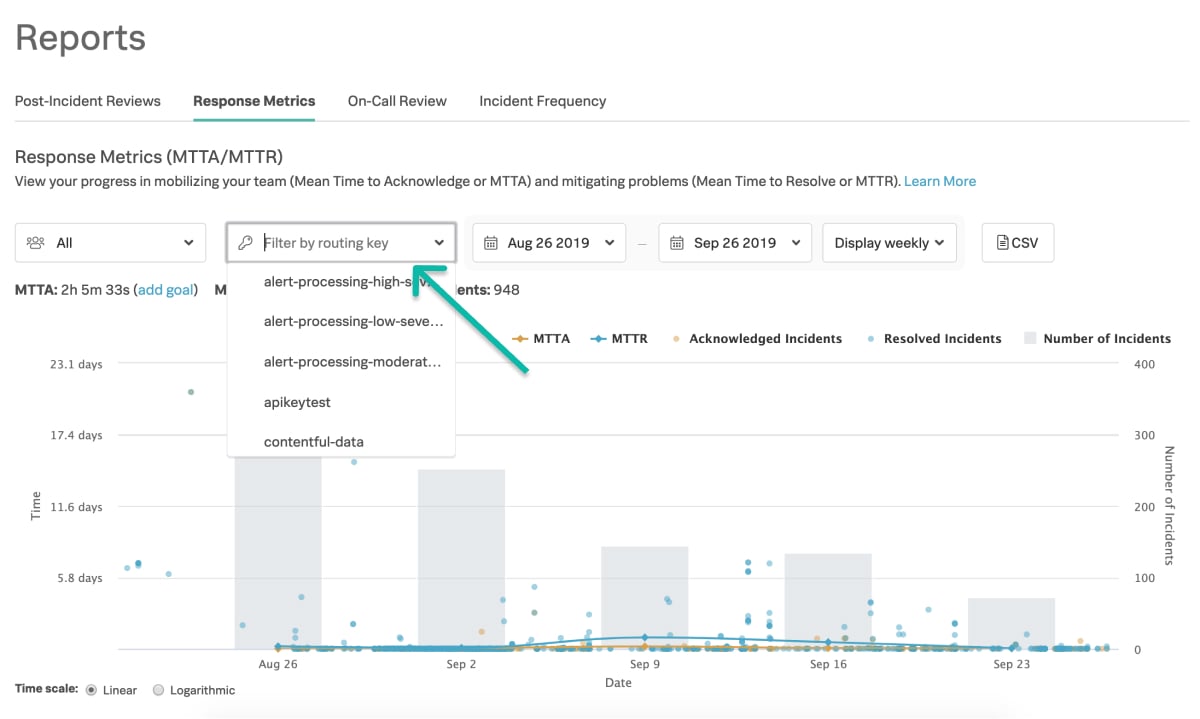
Routing Key Filtering
Target specific or multiple routing keys to understand metrics around different components.
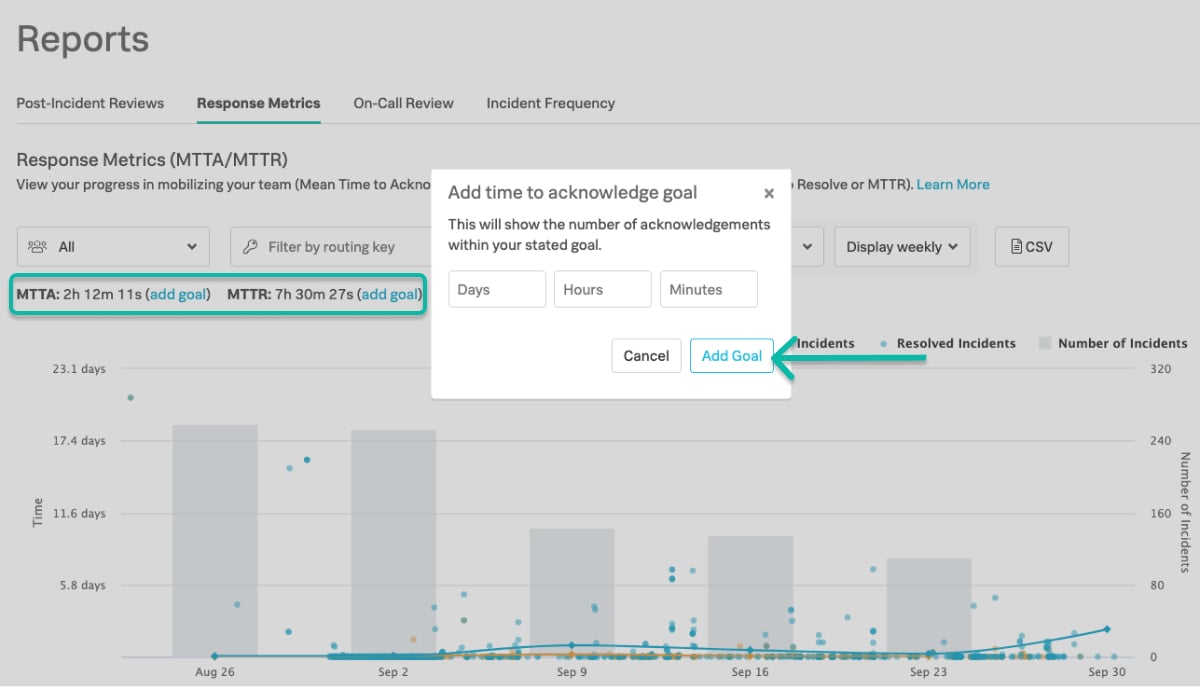
MTTA & MTTR Goal Tracking
Add specific goals against MTTA and MTTR goals. Track these in the daily, weekly, and monthly bucketing increments.
Note: Goals are only saved on a user basis and not saved organization-wide.
Incident Volume by Date Range and Bucketing
Aggregate MTTA and MTTR averages and incident volume by daily, weekly, and monthly buckets.
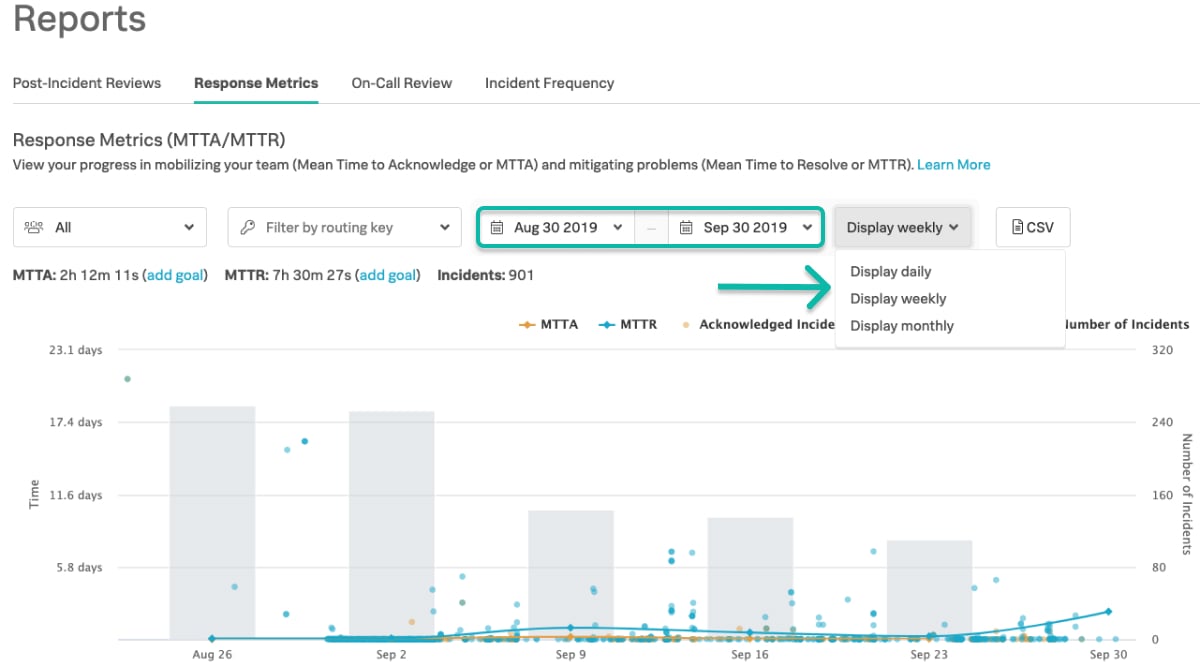
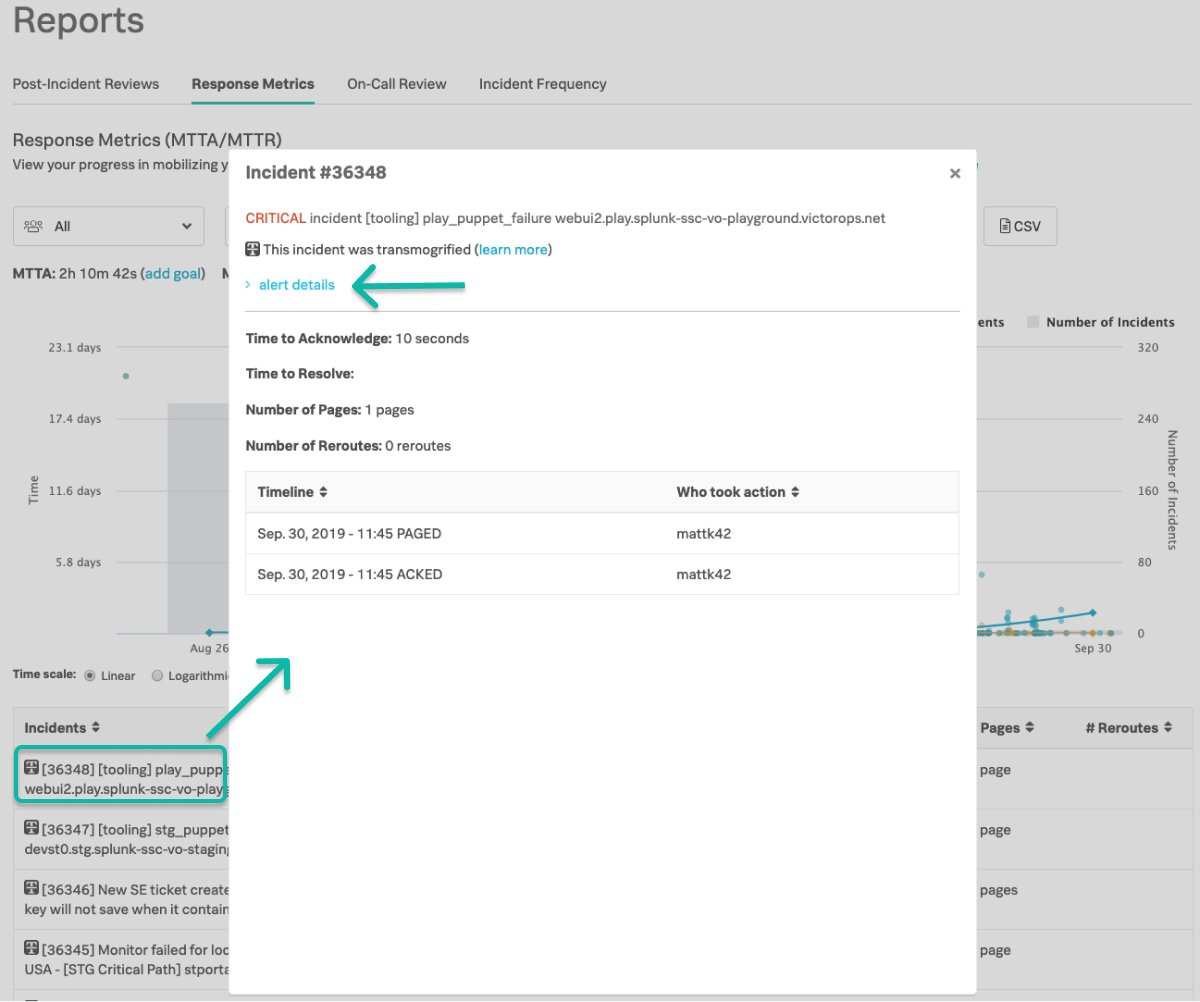
Table View for Recent Incidents
The table view adjusts to match the 100 most recent incidents associated with the selected segment filter. Click on a specific row to learn more about a specific incident, including its ACK/RES history, as well as the individual alert payload.
CSV Download
The data delivered in the CSV will reflect the date range and team segmenting designed in the setting views. Changing the segment by filters and date range bucketing will have no effect on the contents of the download.
Things to note about the CSV
- Timestamps are at millisecond granularity
- CSV is sorted by Incident ID in descending order
CSV File Column Headings
When downloading the Response Metrics CSV file you can expect to find the following columns to include the unit of time/timezone that the incident is recorded in. Time related column headings will appear in this format as of 12/16/2019
| Time to Acknowledge (seconds) |
| Time to Resolve (seconds) |
| Incident Start Time (UTC) |
| Acknowledge Time (UTC) |
| Resolve Time (UTC) |