About Nagios and Splunk On-Call
The Splunk On-Call (formerly VictorOps) and Nagios integration supports both Nagios Core and Nagios XI. Integrating Nagios and Splunk On-Call allows teams to monitor and alert on their entire infrastructure, whether it be cloud, virtual, and/or physical IT environments.
Nagios periodically checks on critical parameters of application, network, and server resources. It can monitor—for example—memory usage, disk usage, microprocessor load, log files, and the quantity of currently running processes. Nagios can also monitor services such as Simple Mail Transfer Protocol (SMTP), Post Office Protocol 3 (POP3), Hypertext Transfer Protocol (HTTP) and other common network protocols. Nagios can provide the data and feed alerts into the Splunk On-Call timeline where issues can be responded to.
The Splunk On-Call and Nagios integration is configurable with a simple self-generated service API key in the Splunk On-Call integrations settings. Based on the parameters and thresholds defined, Nagios can send alerts if critical levels are reached. These notifications can be sent to the appropriate teams in Splunk On-Call through multiple channels including live call routing, native chat, phone, email, and SMS.
Get the most out of your Nagios Alerts
- Easily configure Nagios by generating a service API key within Splunk On-Call
- Configure Nagios to send alerts straight into Splunk On-Call. If a service goes critical, an alert will quickly notify the appropriate teams
- Send heartbeat info to Splunk On-Call to help determine whether your plugin is working correctly–even if alerts are not being generated by Nagios. This integration allows you to collect info and generate alerts in Splunk On-Call, even if your Nagios server seems to be malfunctioning or down
- Use Splunk On-Call to execute Ack-Back Command Poll commands on your Nagios server. Commands issued at Splunk On-Call will be relayed to your Nagios monitor. This configuration is disabled by default, but can be enabled at any point
Nagios Core Integration Guide – VictorOps
Versions Supported: Nagios 4.x and below
VictorOps Version Required: Starter, Growth, or Enterprise
What you need to know: Routing incidents from Nagios to multiple teams in Splunk On-Call requires additional configuration. (See Routing Incidents section of this article). For Nagios environments secluded behind a firewall, see the Nagios Alerts Via Email section.
Nagios Plugin
Splunk On-Call alert processing is implemented as a Nagios contact that is added to a contact group (often ‘admins’, but that will depend on your individual configuration).
The contact mechanism for the Splunk On-Call contact is a simple shell script that spools the alert details to a file on disk. When an alert is fired, and Nagios invokes the contact script, the details wind up in /var/nagios and return to Nagios.
There is a long-running bash script that monitors /var/nagios for new files and posts the data in those files to Splunk On-Call over HTTPS. This forwarding script is monitored by Nagios itself, and if it stops for any reason, the Nagios service check will attempt to restart it.
In the event that this forwarding script is unable to successfully send alerts to Splunk On-Call for a time, it will fall back to sending an email version of the alert. The target address for this fallback alert is configurable (see below).
If you prefer not to install the plugin, see the section below on sending Nagios alerts via email.
Layout
The plugin files are installed to /opt/victorops/nagios_plugin. There is a Nagios configuration file called victorops.cfg in /opt/victorops/nagios_plugin/nagios_conf that contains all configurations for the plugin. Add your company ID, API key and Nagios host name, and move the file to your Nagios configuration directory using
1 | mv /opt/victorops/nagios_plugin/nagios_conf/victorops.cfg /usr/local/nagios/etc |
We recommend that you send all alerts to Splunk On-Call, but your individual case may vary.
Installation
Depending on your system you may need to use sudo with these commands.
deb install
- Execute
wget https://github.com/victorops/monitoring_tool_releases/releases/download/victorops-nagios-1.4.20/victorops-nagios_1.4.20_all.deb
- Execute
dpkg -i <path_to_file>
If you don’t want to use dpkg you can also use
sudo apt install <path_to_file>
rpm install
- Execute
wget https://github.com/victorops/monitoring_tool_releases/releases/download/victorops-nagios-1.4.20/victorops-nagios-1.4.20-1.noarch.rpm
- Execute
rpm -i <path_to_file>
Configuration
If you install from the DEB or RPM packages, the installer will put the plugin files in the location /opt/victorops/nagios_plugin and create the logging and alert directories.
After installation, you’ll need to move the victorops.cfg file to your Nagios configuration directory, and modify both the nagios.cfg and victorops.cfg files.
Modify nagios.cfg
Sending alerts to Splunk On-Call is done via a shell script that requires the Nagios/Icinga environment macros. To enable this Nagios functionality, open /etc/nagios/nagios.cfg (or icinga.cfg, actual path may vary) and find the enable_environment_macros directive. Make sure this is set to:
1 | enable_environment_macros=1 |
If this directive does not exist, add it to the config file.
Still within the nagios.cfg file, add this line which tells Nagios where to find your Splunk On-Call Configuration file. Using your unique file path, this line should read something similar to:
1 | cfg_file=/usr/local/nagios/etc/victorops.cfg |
Modify victorops.cfg
This file defines where the Nagios alert will route to (more info in Routing Incidents section below), amongst other variables.
Move victorops.cfg to your Nagios configuration directory using
1 | mv /opt/victorops/nagios_plugin/nagios_conf/victorops.cfg /usr/local/nagios/etc |
Open up the victorops.cfg file itself, and configure the following values as both the VictorOps_Contact_Settings (~line 20) contact and VictorOps_Service_Settings (~line 40) service object definitions:
- _VO_ORGANIZATION_ID (~line 24 & 44) (case sensitive)
- This is your org slug. It can be found by accessing Splunk On-Call Timeline and then looking at the URL. The _VO_ORGANIZATION_ID will be the string that appears after ‘/client/’.
- _VO_ORGANIZATION_KEY (~line 25 & 26)
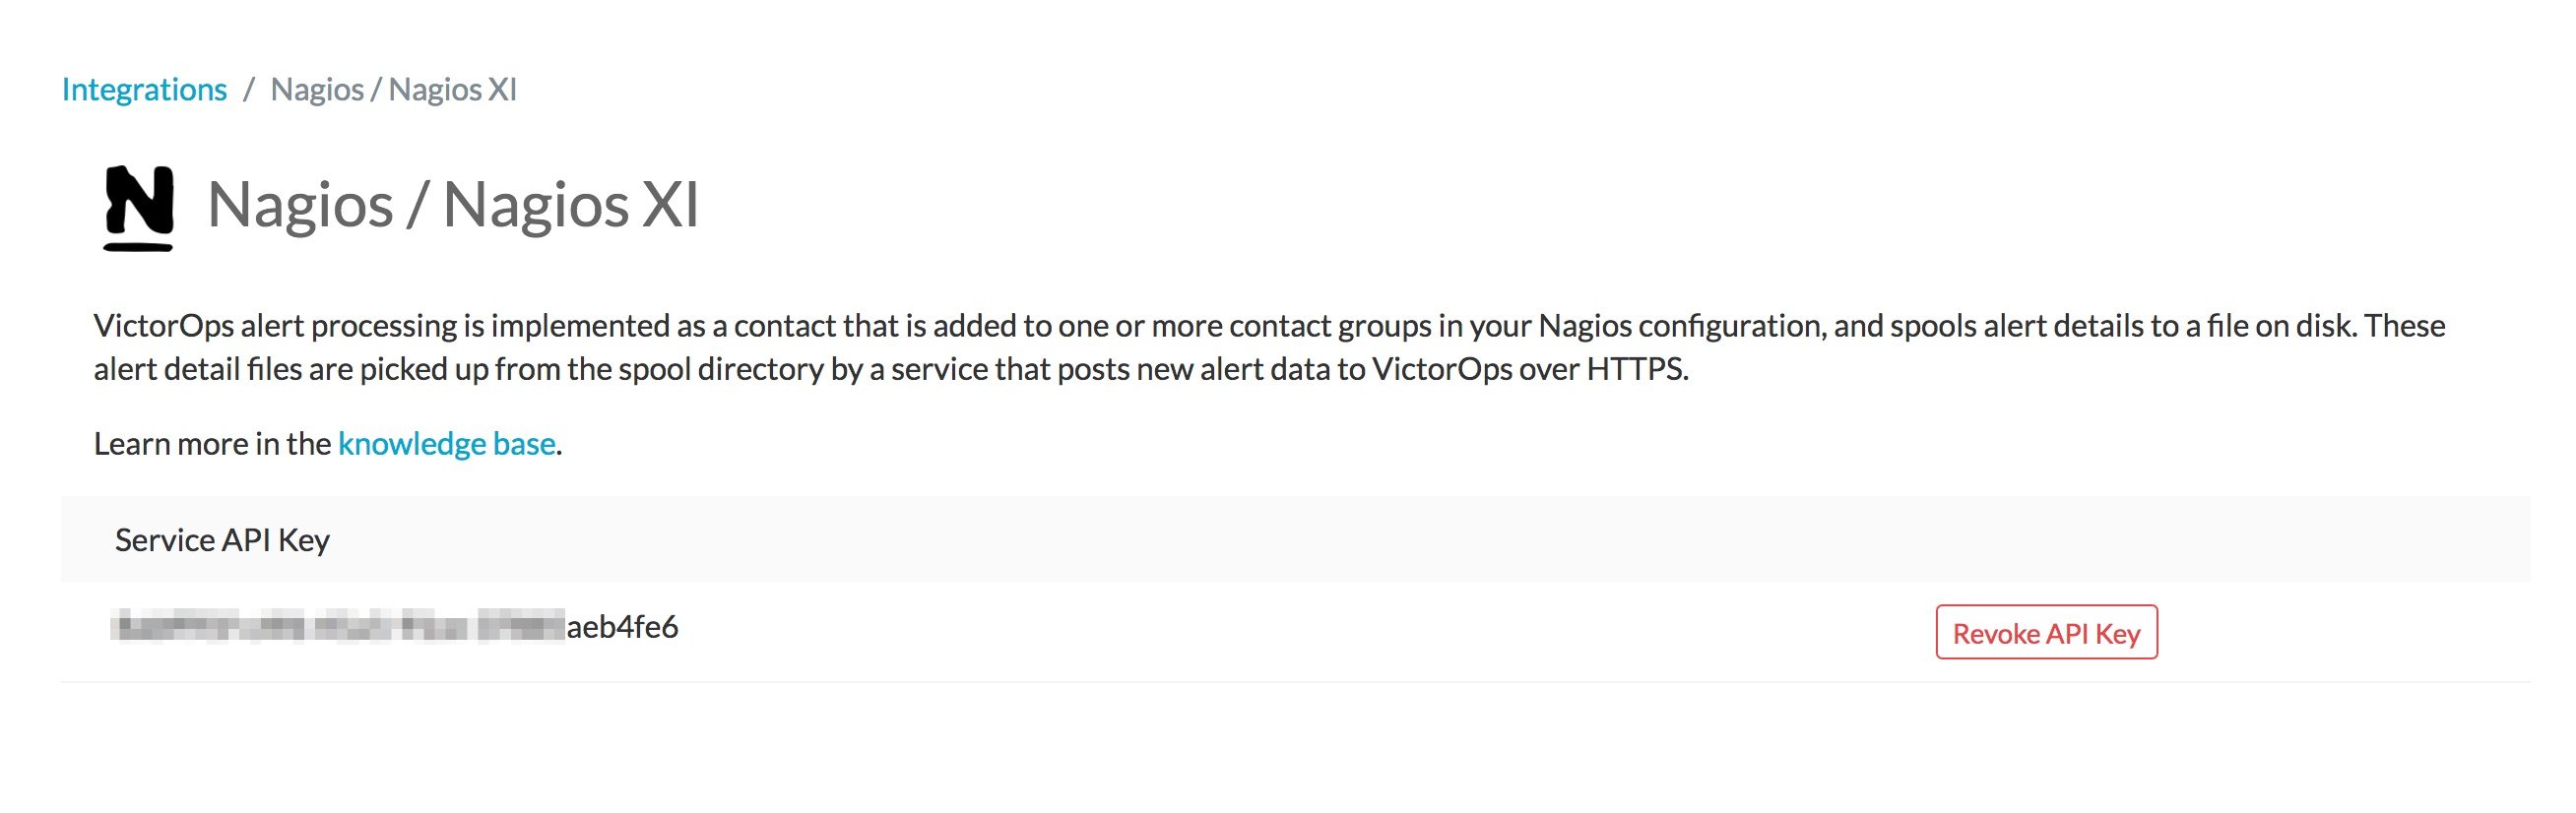
- Can be found In Splunk On-Call by following Integrations >> Nagios. It will be listed as ‘Service API Key’
To generate a Service API Key, in Splunk On-Call select Integrations >> Nagios.
If the integration has not yet been enabled, click the “Enable Integration” button to generate your configuration values as seen here:
Also required:
(~Line 51)
This value is in the VictorOps_Service_Settings (line 40) service object definition. It is the name of your Nagios host, as defined to Nagios. It enables the heartbeat and command check services discussed below.
Additional configuration options:
_VO_MONITOR_NAME (~line 24 & 46)
This identifies the Nagios instance to Splunk On-Call and may be left blank. If you are using multiple Nagios servers in your architecture, you should distinguish them with unique IDs in this field.
_VO_CONTACTEMAIL (~line 32)
A backup email address to send alerts to. If for any reason the plugin is unable to relay alerts to Splunk On-Call, an alert email will be sent to this address. We recommend including an email-SMS gateway in this list. You may configure multiple addresses by separating them with spaces and enclosing the whole thing in single quotes:
‘me@mydomain.com you@mydomain.com him@mydomain.com 3035551212@vtext.com’
_VO_MAX_SEND_DELAY (~line 36)
The maximum amount of time (in seconds) that alerts will be allowed to remain in the queue before the alert is sent to the contact address above.
Additional services
These four services will appear on the Nagios server in the Nagios dashboard. By default, notifications for these services are disabled. If you wish to enable alerts for them, simply edit their service definitions in victorops.cfg.
Splunk On-Call Alert Forwarder:
This is a process check for the long-running script described above. If this service goes critical, it will raise an alert via email (since normal alert forwarding can’t work when this service is down).
Heartbeat:
The victorops.cfg file defines a service to send heartbeat info to Splunk On-Call. This service is enabled by default, and can be helpful in determining whether your plugin is working correctly, even if there are no alerts being generated by Nagios. Though today this service is just collecting info, it will eventually be used to generate alerts at VictorOps if your Nagios server seems to be malfunctioning or down.
Ack-Back Command Poll:
This service will poll Splunk On-Call for commands to execute on your Nagios server. This service is disabled by default. The purpose is to allow commands issued at Splunk On-Call to be relayed to your Nagios monitor. At this time, the only commands allowed by this service are host and service acknowledgements. Learn more.
Status Resync:
This service can send a complete Nagios status to Splunk On-Call. It can be used in the event that Splunk On-Call gets out of sync with your Nagios system. This might happen, for example, if you had notifications disabled in Nagios for a time. It requires cURL be installed on the Nagios host. There are two flavors, manual and auto. As you might guess, the manual flavor can only be invoked manually (via the Nagios console).
Verifying the Installation
After installing and configuring the plugin, you can verify functionality by using Nagios to send a custom notification for some service you have defined. The alert should be received by Splunk On-Call and appear in your company timeline.
The contact script and alert forwarder write logs in /var/log/victorops. If the plugin does not seem to be working correctly, check these logs for errors.
Routing Incidents:
With the Nagios/Icinga plugin for Splunk On-Call, the routing key sent to Splunk On-Call is the name of whatever contact group contains the Splunk On-Call contact. If you would like Nagios to be able to route various incidents to multiple teams in Splunk On-Call, you will need to create a unique contact, and unique contact group (with the one contact as the sole member) for each routing key you wish to use in Splunk On-Call. (Routing keys can be set up in Splunk On-Call by clicking Settings >> Routing Keys)
In the below example, assume there are 3 teams in Splunk On-Call that will be receiving incidents from Nagios. (DevOps, SRE, & Database)
First, define a contact for each team in your nagios configuration file, using the VictorOps_Contact settings that is defined in victorops.cfg:
DevOps Team Contact
1 2 3 4 5 6 | define contact{ use VictorOps_Contact name VictorOps_devops contact_name VictorOps_devops alias VictorOps_devops } |
SRE Team Contact
1 2 3 4 5 6 | define contact{ use VictorOps_Contact name VictorOps_sre contact_name VictorOps_sre alias VictorOps_sre } |
Database Team Contact
1 2 3 4 5 6 | define contact{ use VictorOps_Contact name VictorOps_database contact_name VictorOps_database alias VictorOps_database } |
Next, define a unique contact group for each of the contacts defined above and add those contacts as the sole member, respectively. The routing_key value used in the alert to Splunk On-Call is derived from the contactgroup_name, so make sure that these names match the the values you wish to use in Splunk On-Call (or change the routing_keys in Splunk On-Call to match the names you define here)
DevOps Contact Group (routing_key = devops)
1 2 3 4 5 | define contactgroup{ contactgroup_name devops alias VictorOps DevOps contact group members VictorOps_devops } |
SRE Contact Group (routing_key = sre)
1 2 3 4 5 | define contactgroup{ contactgroup_name sre alias VictorOps SRE contact group members VictorOps_sre } |
Database Contact Group (routing_key = database)
1 2 3 4 5 | define contactgroup{ contactgroup_name database alias VictorOps Database contact group members VictorOps_database } |
Finally, add the contact groups to their appropriate check commands, and they will arrive with the correct routing key (contactgroup_name). Note: you may add the Splunk On-Call contact to as many “contact_groups” as you like, and you may also add the Splunk On-Call contact to specific services.
Nagios Alerts Via Email:
If your Nagios environment is restricted behind a firewall or if you simply would rather not install the plugin on your Nagios hosts, you can still send Nagios alerts to Splunk On-Call via email. These alerts will show up in your timeline in a more limited format without the extended functionality provided by the plugin.
To send Nagios alerts to Splunk On-Call, simply create a Nagios contact using the sample configuration shown below, and add that contact to one of the Nagios contact groups that normally receives alerts from your system.
In the sample configuration given, the organization ID and organization key allow us to validate the alerts and route them to your timeline. The values can be found under the Integrations section of the Splunk On-Call web app. The mail command in the configuration will format the alert details into the alert email appropriately.
1 2 3 4 5 6 7 8 9 10 11 12 13 14 15 16 17 18 19 20 21 22 23 24 25 26 27 28 29 30 31 32 33 34 35 36 | ##------------------------------------------------------------------------------------------ ## These Nagios contact and service definitions are used to pass configurable values to the email command. ## ## Contact settings: ## _VO_ORGANIZATION_ID ## _VO_ORGANIZATION_KEY ## These identify your alerts to VictorOps. The values for these fields are assigned to you by VictorOps. ## ## _VO_MONITOR_NAME ## VictorOps supports multiple Nagios instances per organization. This configuration value identifies the instance to ## VictorOps. It can be set to something you choose (such as the name of this Nagios host). ## ##------------------------------------------------------------------------------------------ define contact{ contact_name VictorOps_Email ## Configure these values as described above _VO_ORGANIZATION_ID xxxxxxxxxxxxx _VO_ORGANIZATION_KEY xxxxxxxx-xxxx-xxxx-xxxx-xxxxxxxxxxxx _VO_MONITOR_NAME alias VictorOps_Email service_notification_period 24x7 host_notification_period 24x7 service_notification_options w,u,c,r host_notification_options d,r service_notification_commands notify-victorops-by-email host_notification_commands notify-victorops-by-email register 1 _VO_ALERT_DOMAIN alert.victorops.com } define command{ command_name notify-victorops-by-email command_line /usr/bin/printf "%b" "\nVO_ORGANIZATION_ID=$_CONTACTVO_ORGANIZATION_ID$\nVO_ ORGANIZATION_KEY=$_CONTACTVO_ORGANIZATION_KEY$\n_CONTACTVO_ORGANIZATION_KEY=$_CONTACTVO_ORGANIZATION_KEY$\nVO_MONITOR_NAME=$_CONTACTVO_MONITOR_NAME$\n_CONTACTVO_MONITOR_NAME=$_CONTACTVO_MONITOR_NAME$\nTIMET=$TIMET$\nDATE=$DATE$\nTIME=$TIME$\nHOSTNAME=$HOSTNAME$\nHOSTALIAS=$HOSTALIAS$\nHOSTDISPLAYNAME=$HOSTDISPLAYNAME$\nHOSTSTATE=$HOSTSTATE$\nLASTHOSTSTATECHANGE=$LASTHOSTSTATECHANGE$\nHOSTOUTPUT=$HOSTOUTPUT$\nHOSTPERFDATA=$HOSTPERFDATA$\nHOSTGROUPALIAS=$HOSTGROUPALIAS$\nHOSTGROUPNAME=$HOSTGROUPNAME$\nHOSTGROUPMEMBERS=$HOSTGROUPMEMBERS$\nHOSTGROUPNAMES=$HOSTGROUPNAMES$\nSERVICEDESC=$SERVICEDESC$\nSERVICEDISPLAYNAME=$SERVICEDISPLAYNAME$\nSERVICESTATE=$SERVICESTATE$\nLASTSERVICESTATECHANGE=$LASTSERVICESTATECHANGE$\nSERVICEOUTPUT=$SERVICEOUTPUT$\nSERVICECHECKCOMMAND=$SERVICECHECKCOMMAND$\nCONTACTGROUPNAME=$CONTACTGROUPNAME$\nNOTIFICATIONTYPE=$NOTIFICATIONTYPE$\nNOTIFICATIONAUTHOR=$NOTIFICATIONAUTHOR$\nNOTIFICATIONCOMMENT=$NOTIFICATIONCOMMENT$\n" | /usr/bin/mail -s "$_CONTACTVO_ORGANIZATION_ID$:$_CONTACTVO_ORGANIZATION_KEY$:$_CONTACTVO_MONITOR_NAME$" $_CONTACTVO_ORGANIZATION_KEY$@$_CONTACTVO_ALERT_DOMAIN$ } |
Centos 5 Timeouts:
To avoid timeouts when using Centos 5, you will need to link the timeout command to a directory that’s in the path.
First, create the symlink:
1 | ln -s /usr/share/doc/bash-3.2/scripts/timeout /usr/bin/timeout |
Next, make it executable:
1 | chmod 755 /usr/share/doc/bash-3.2/scripts/timeout |
Nagios XI Integration Guide – Splunk On-Call
Versions Supported: Nagios XI 5.x and below
VictorOps Version Required: Starter, Growth, or Enterprise
Fully install the Splunk On-Call plugin package for Nagios/Icinga before proceeding with the following setup. Note that configuration steps in the sections below need not be performed, as Nagios XI requires a different configuration process as follows.
Enable Environment Macros
Sending alerts to Splunk On-Call is done via a shell script that requires the Nagios/Icinga environment macros. To enable this Nagios functionality, find the enable_environment_macros directive in /etc/nagios/nagios.cfg (actual path may vary) and make sure it is set to “1”. If this directive does not exist, add it to the config file.
1 | enable_environment_macros=1 |
Import the Configuration
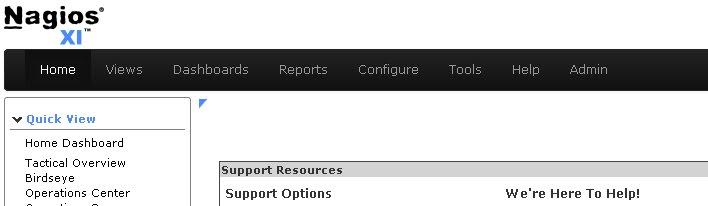
In the Nagios XI dashboard click Configure in the top menu:
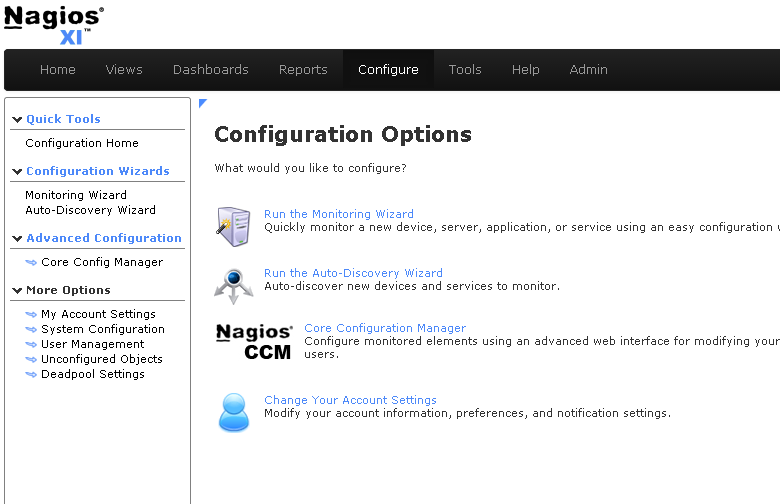
Click Core Config Manager in the left-hand menu:
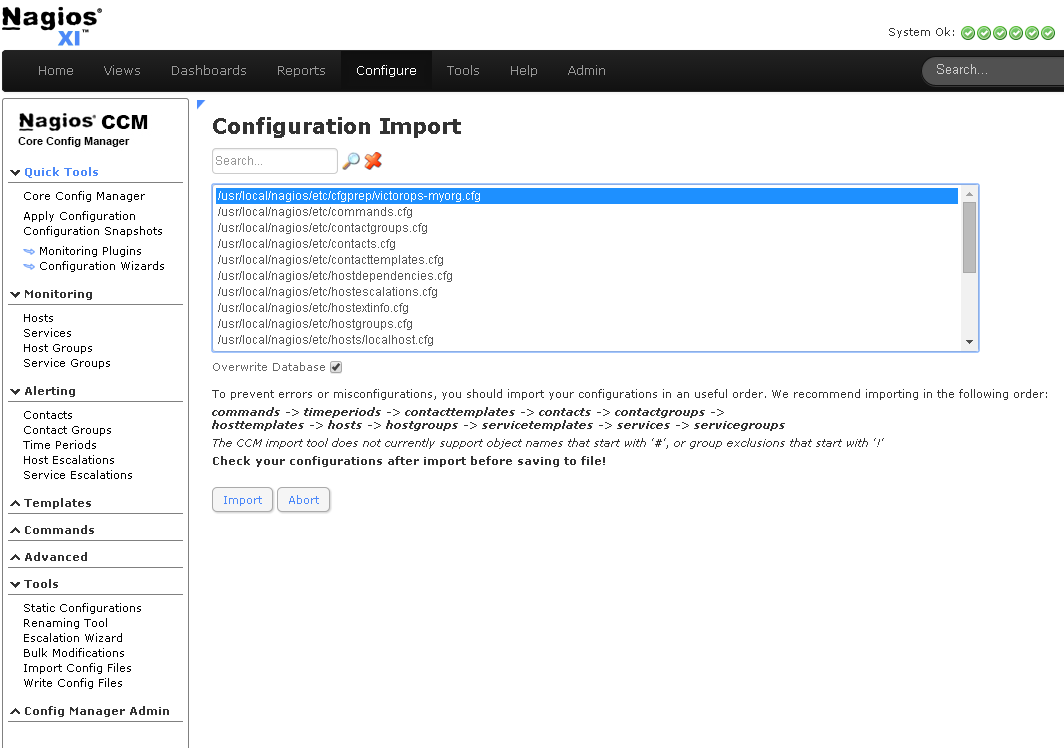
Click Tools -> Import Config Files in the left-hand menu. Select the config from the file list, then click the “Import” button:
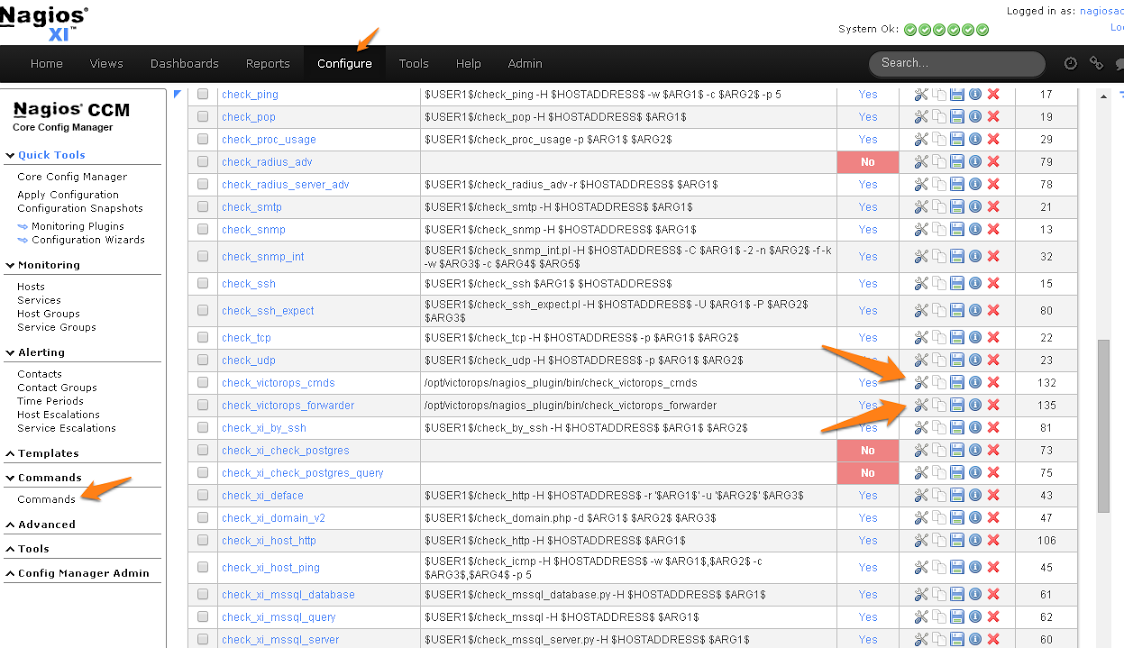
Nagios XI imports our service check commands as “misc command”. In order to enable ack-back through the Nagios XI UI, the service check will have to be changed to a “check command”. Navigate to the Core Config Manager, and bring up the list of commands. Then click the little configure icon for the “check_victorops_cmds” command:
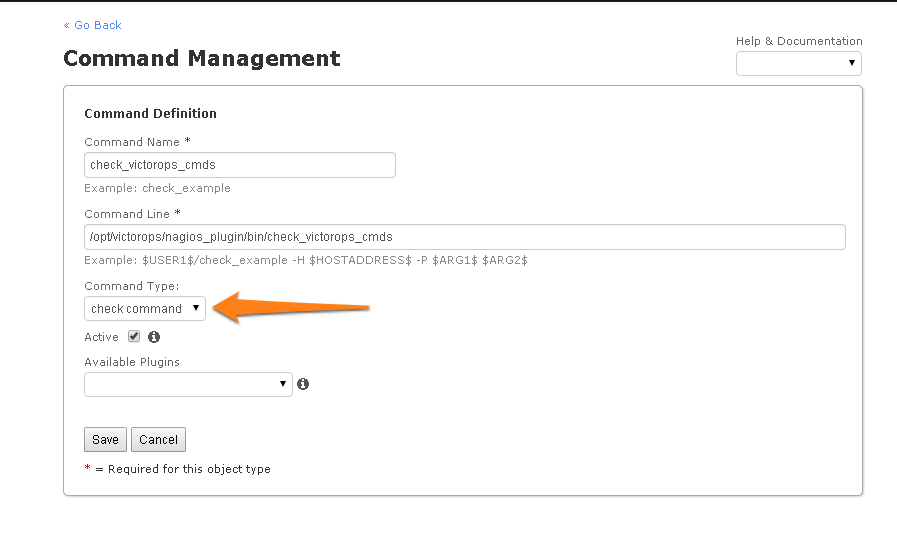
Once in that dialog, change the command type to “check command” and save:
Send Alerts to Splunk On-Call
You should now be able to enable active checks on the “VictorOps Command Poll” service through the Nagios XI interface.
If alerts still aren’t coming through, try copying this file /opt/victorops/nagios_plugin/nagios_conf/victorops.cfg to: /usr/local/nagios/etc/cfgprep/victorops.cfg
If you are experiencing the error Duplicate definition found for contact ‘VictorOps_Contact_Settings’ then remove the line cfg_file=/usr/local/nagios/etc/victorops.cfg from nagios.cfg.