Splunk transforms machine-generated data into valuable insights that can help make your business more productive, profitable, and secure. The following guide will walk you through integrating VictorOps with action alerts from searches in Splunk Enterprise and cloud.
Splunk Versions Supported:
- Splunk Enterprise (on-prem): 9.1, 9.0, 8.2, 8.1, 8.0, 7.3, 7.2, 7.1, 7.0 7.0
- Splunk Cloud: 9.1, 9.0, 8.2, 8.1, 8.0, 7.3, 7.2, 7.1, 7.0
General Requirement:
- You will need an active VictorOps instance before you begin. Click here to start a free 14-day trial.
- Required Roles/Capabilities:
-
For v.1.0.23 or newer
-
Setup and Configuration you will need to be an:
-
admin OR
-
victorops_admin AND admin_all_objects
-
list_storage_passwords AND admin_all_objects
-
-
Usage and Testing (configuring and testing alerts):
-
admin
-
victorops_admin
-
victorops_user
-
-
-
For v.1.0.18 or below to setup and configure you will need to grant the user:
-
list_storage_passwords AND admin_all_objects
-
-
- On-Prem
- customers will need to open port 443 for outgoing https communication with VictorOps. The full url used will be
-
https://alert.victorops.com/integrations/generic/20131114/alert/$your_api_key/$your_routing_key.
-
- customers will need to open port 443 for outgoing https communication with VictorOps. The full url used will be
Configuring Splunk Enterprise
Important Notes:
- When updating to a newer version of the app, run the bump command to clear client and server assets that have been cached. https://docs.splunk.com/Documentation/Splunk/8.0.3/AdvancedDev/CustomizationOptions
-
http://<host:mport>/<locale_string>/_bump
-
In VictorOps
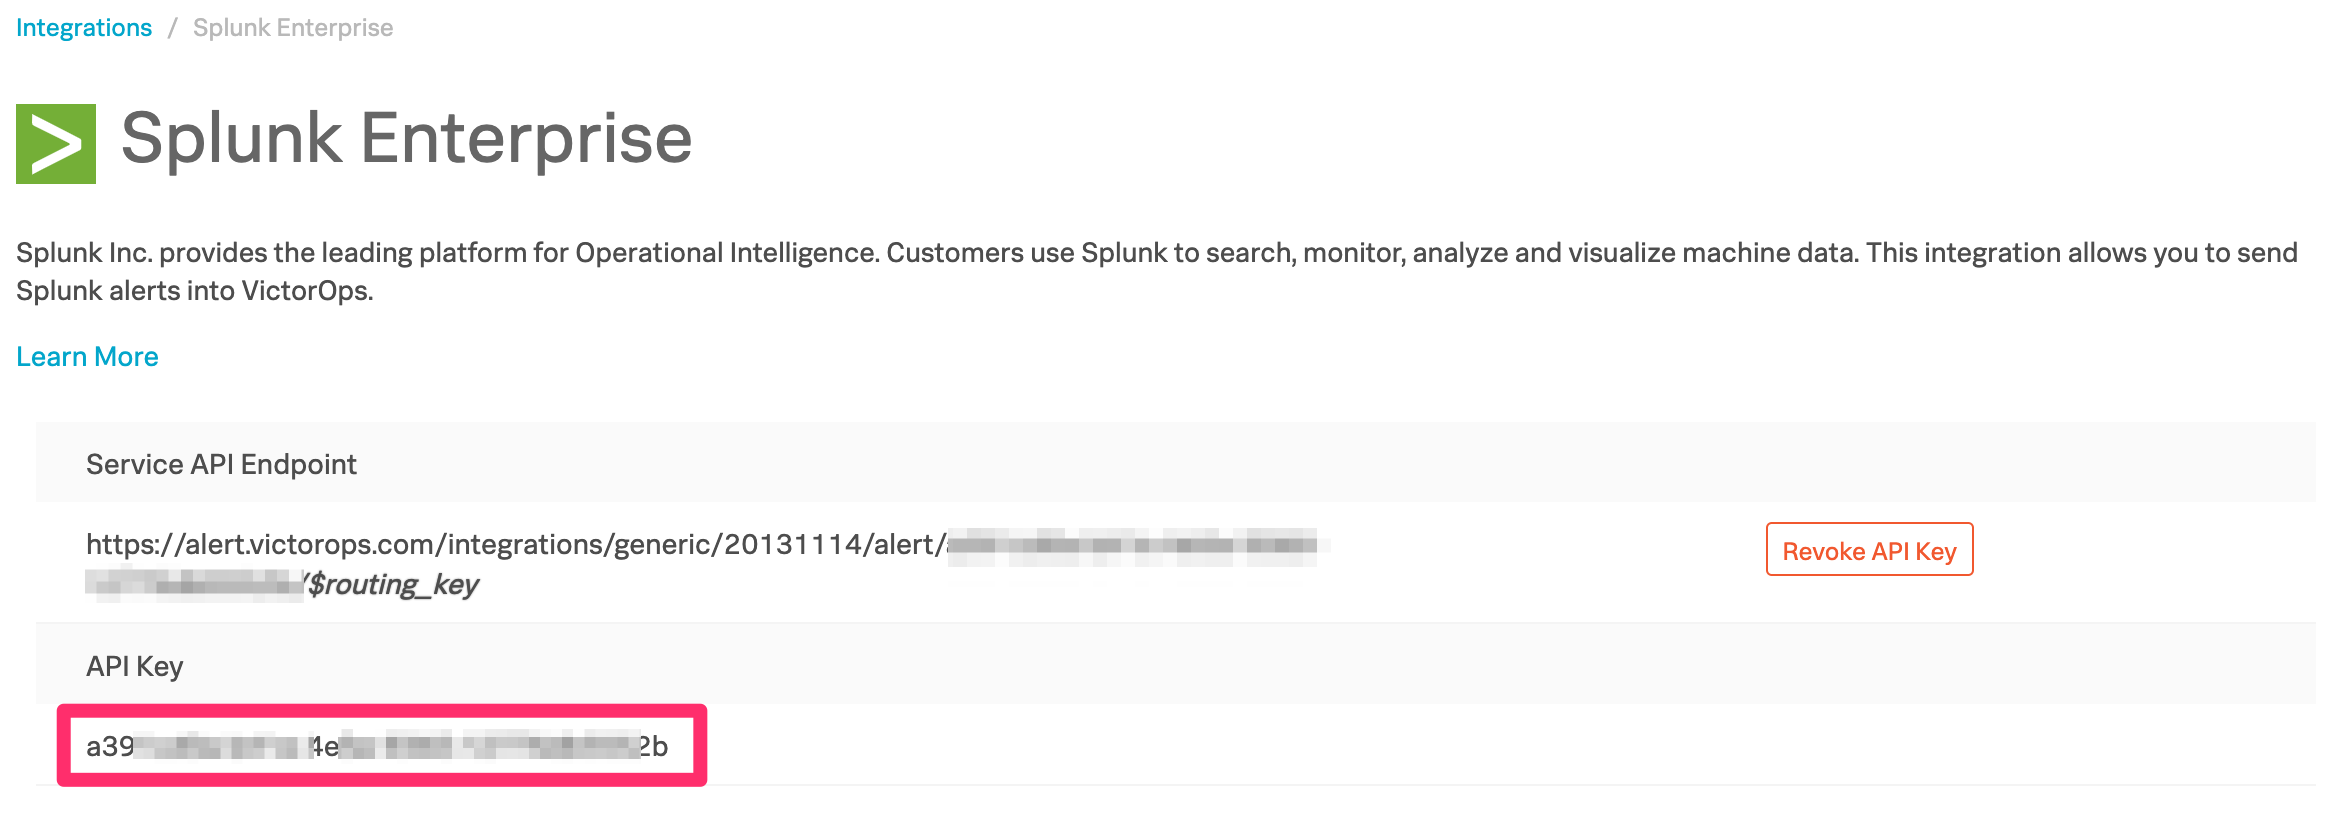
From the VictorOps web portal, navigate to Integrations >> 3rd Party Integrations >> Splunk Enterprise then click Enable Integration. Copy the API key to the clipboard to use in later steps.
In Splunk
From the Splunk Base, search for VictorOps, or follow this link. Click the Download button and accept the license agreements by checking the boxes and clicking Agree to Download.
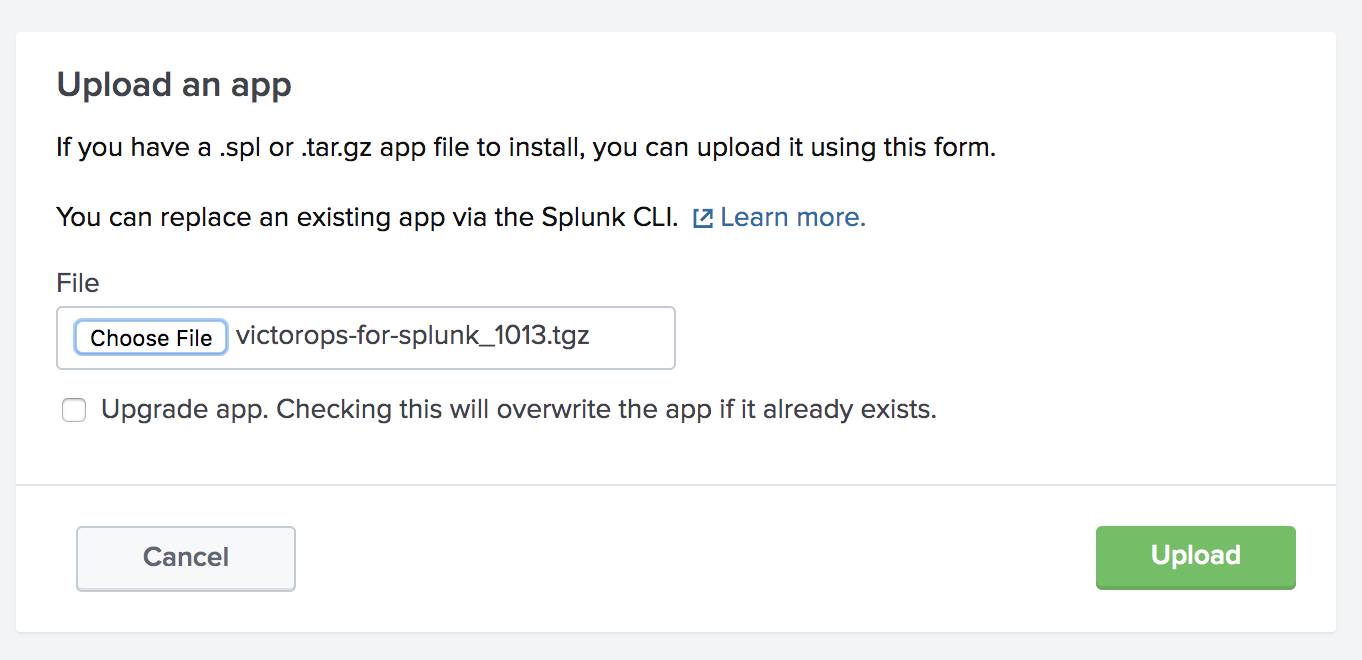
Start Splunk and open the web UI in a browser. From the top navigation bar, expand the drop-down menu and select Manage Apps. Next, click the button Install app from file.

Choose the VictorOps for Splunk app .tgz file downloaded earlier, check Upgrade app box to ensure your application is updated to the latest version. Click Upload then finish the process by restarting Splunk.
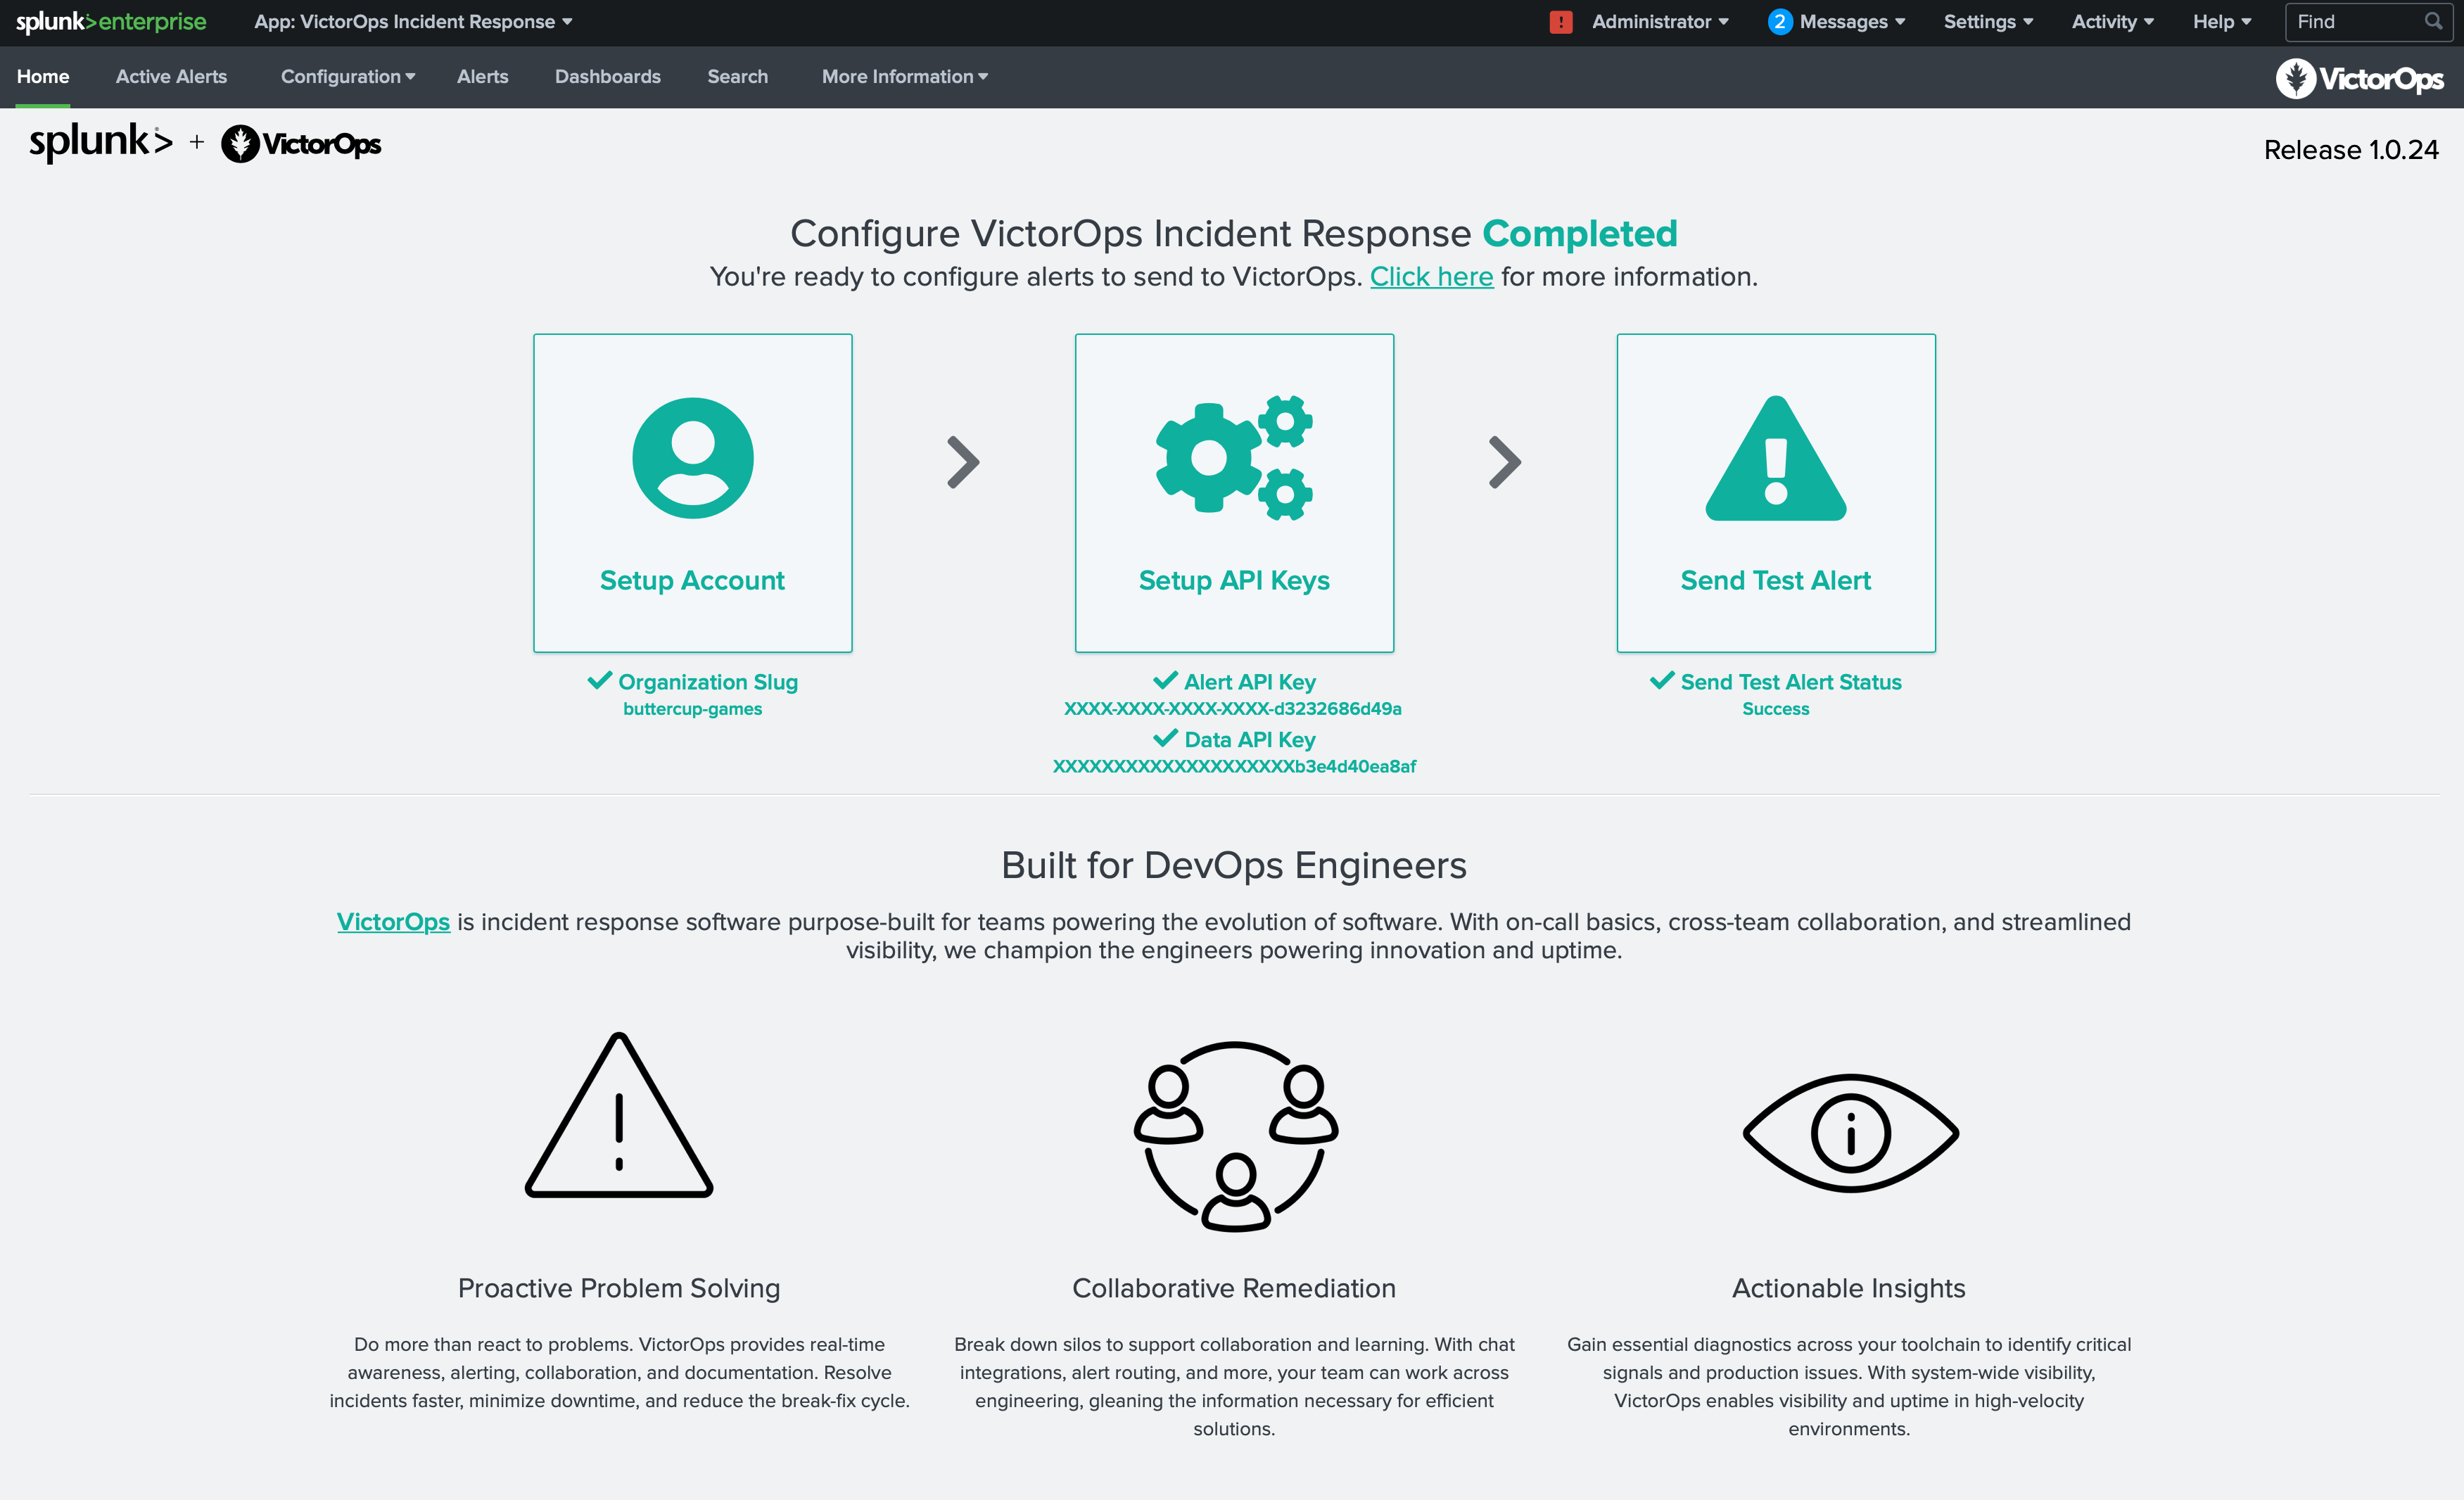
Once Splunk has restarted, return to the Manage Apps page and click Launch App next to the VictorOps Incident Management app.
You will be taken to the VictorOps Incident Response Home page which will guide you through setting up the account, configuring API keys, and testing alerts. Once your configuration is complete you will see a check next to each configuration step.
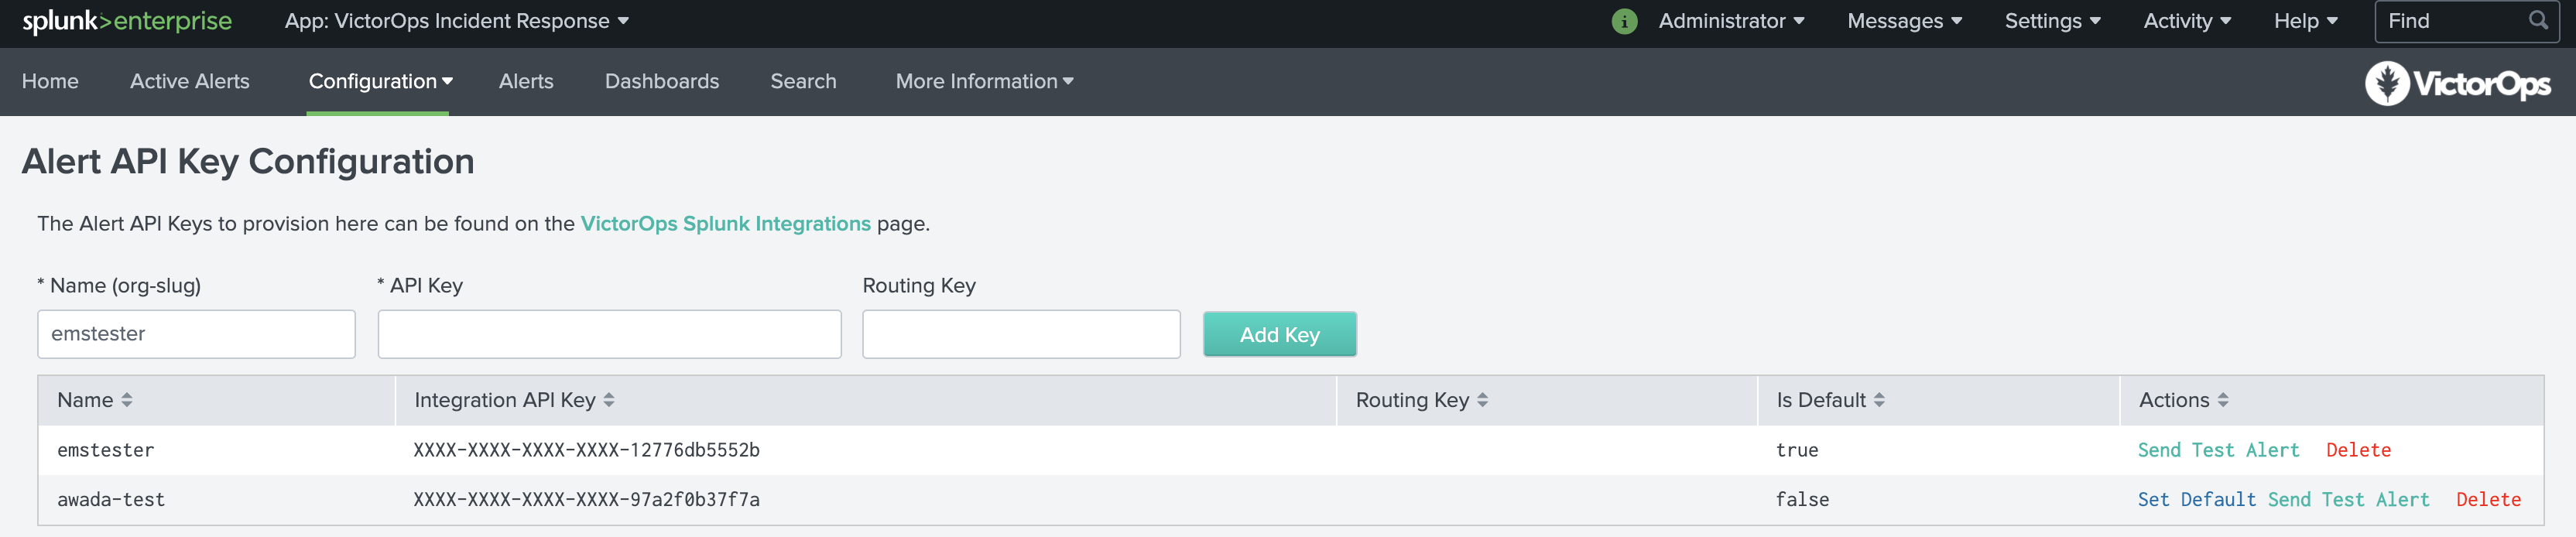
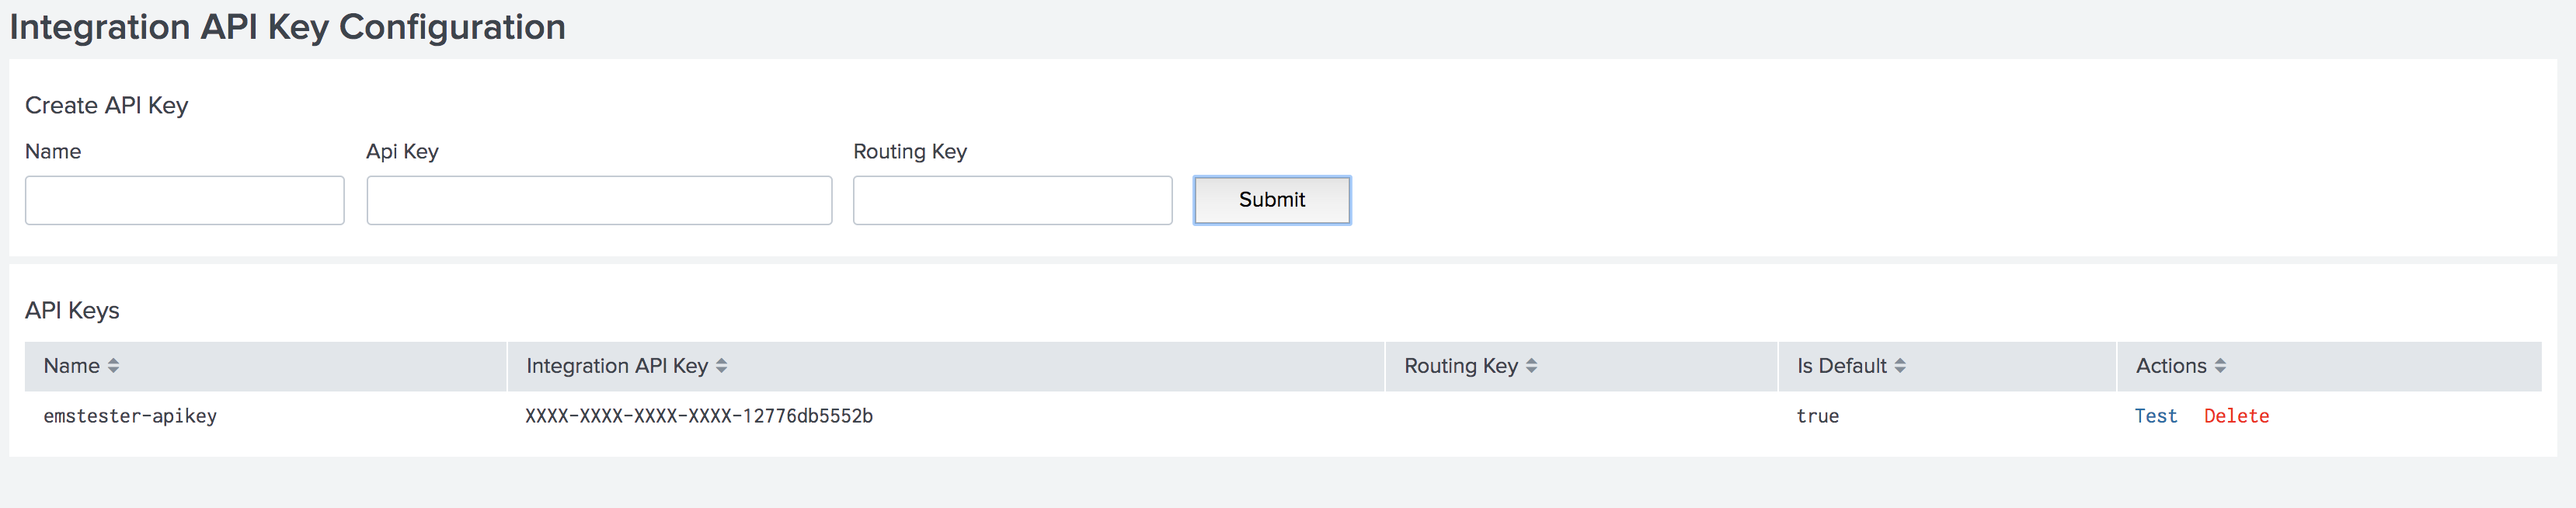
Alert API Key Configuration
On the Alert API Key Configuration page, paste the API key copied earlier, along with any desired routing key from your VictorOps organization. If the routing key is left blank, alerts will be routed to your default routing key. You will also be able to access your API key by clicking the VictorOps Splunk Integration link.
Testing Configuration
Once API is saved you will be able to verify the integration by selecting Test under actions. You will see success as well as an alert in your VictorOps timeline.
NOTE: This test alert will not be an Incident in your org as it is an INFO alert. To find this test alert, you’ll want to look in your Timeline instead of the Incidents tab.
Also, from the Search app in Splunk, you can directly type
| sendalert victorops param.message_type="INFO"
to send a test alert directly to your VictorOps timeline. To create an incident, simply change INFO to CRITICAL. If you have any questions, please contact VictorOps Support.
VictorOps can now be used as an Alert Action.
Data API Configuration & Routing Keys
For versions 1.0.21 and above you will now be able to add your VictorOps API ID and API Key, found in VictorOps under Integrations >>> API, to retrieve routing keys within VictorOps. If you have yet to generate your API key and ID, please enable and generate your orgs key and ID.
Once the API Key and API ID have been saved, click Retrieve Routing Keys to retrieve the most up to date list of your organizations routing keys.
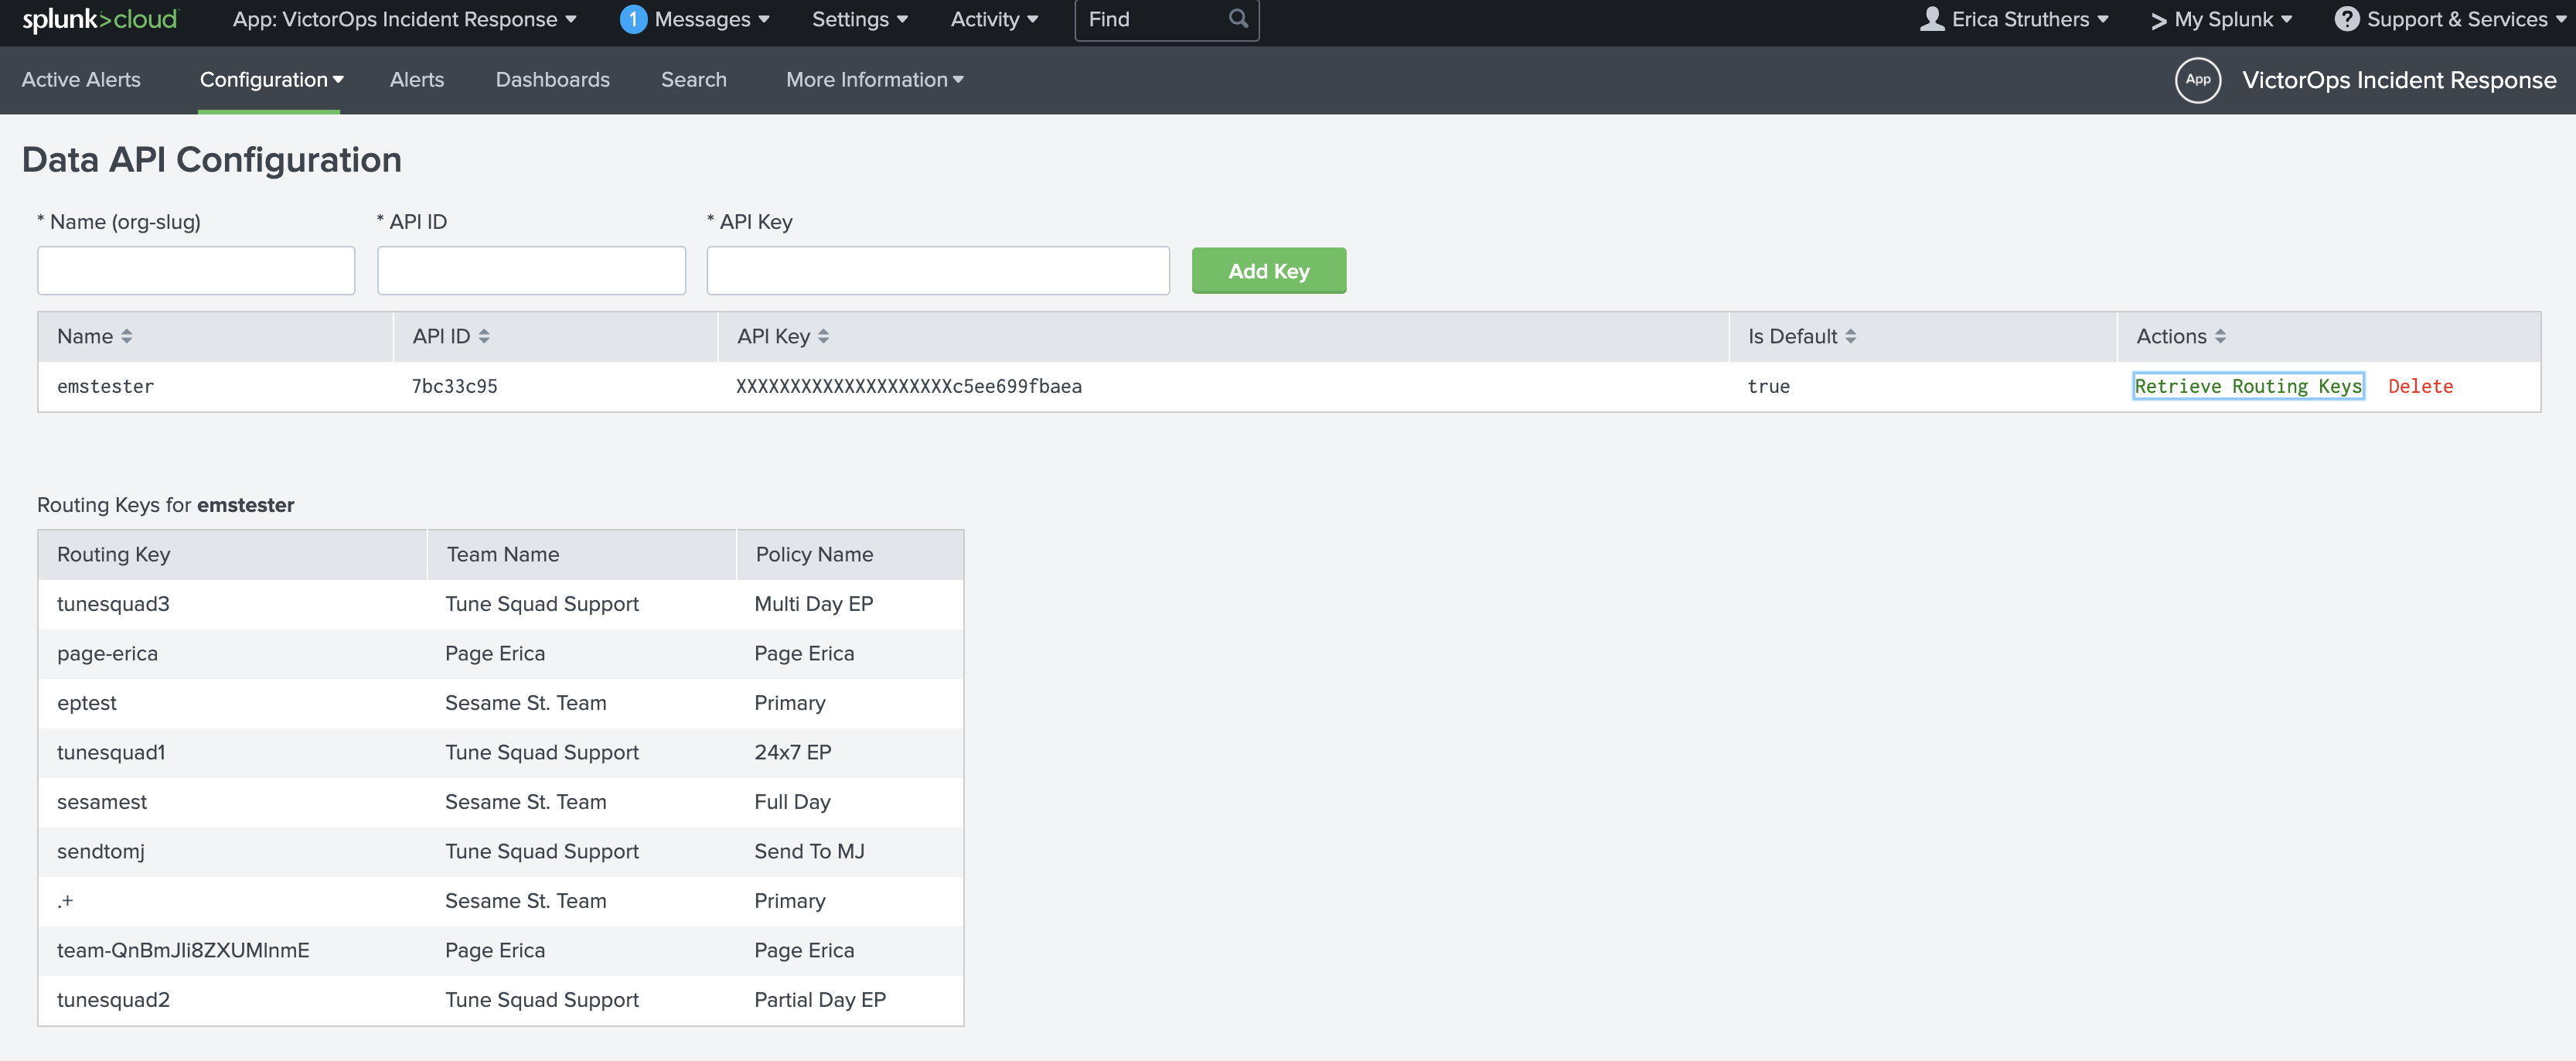
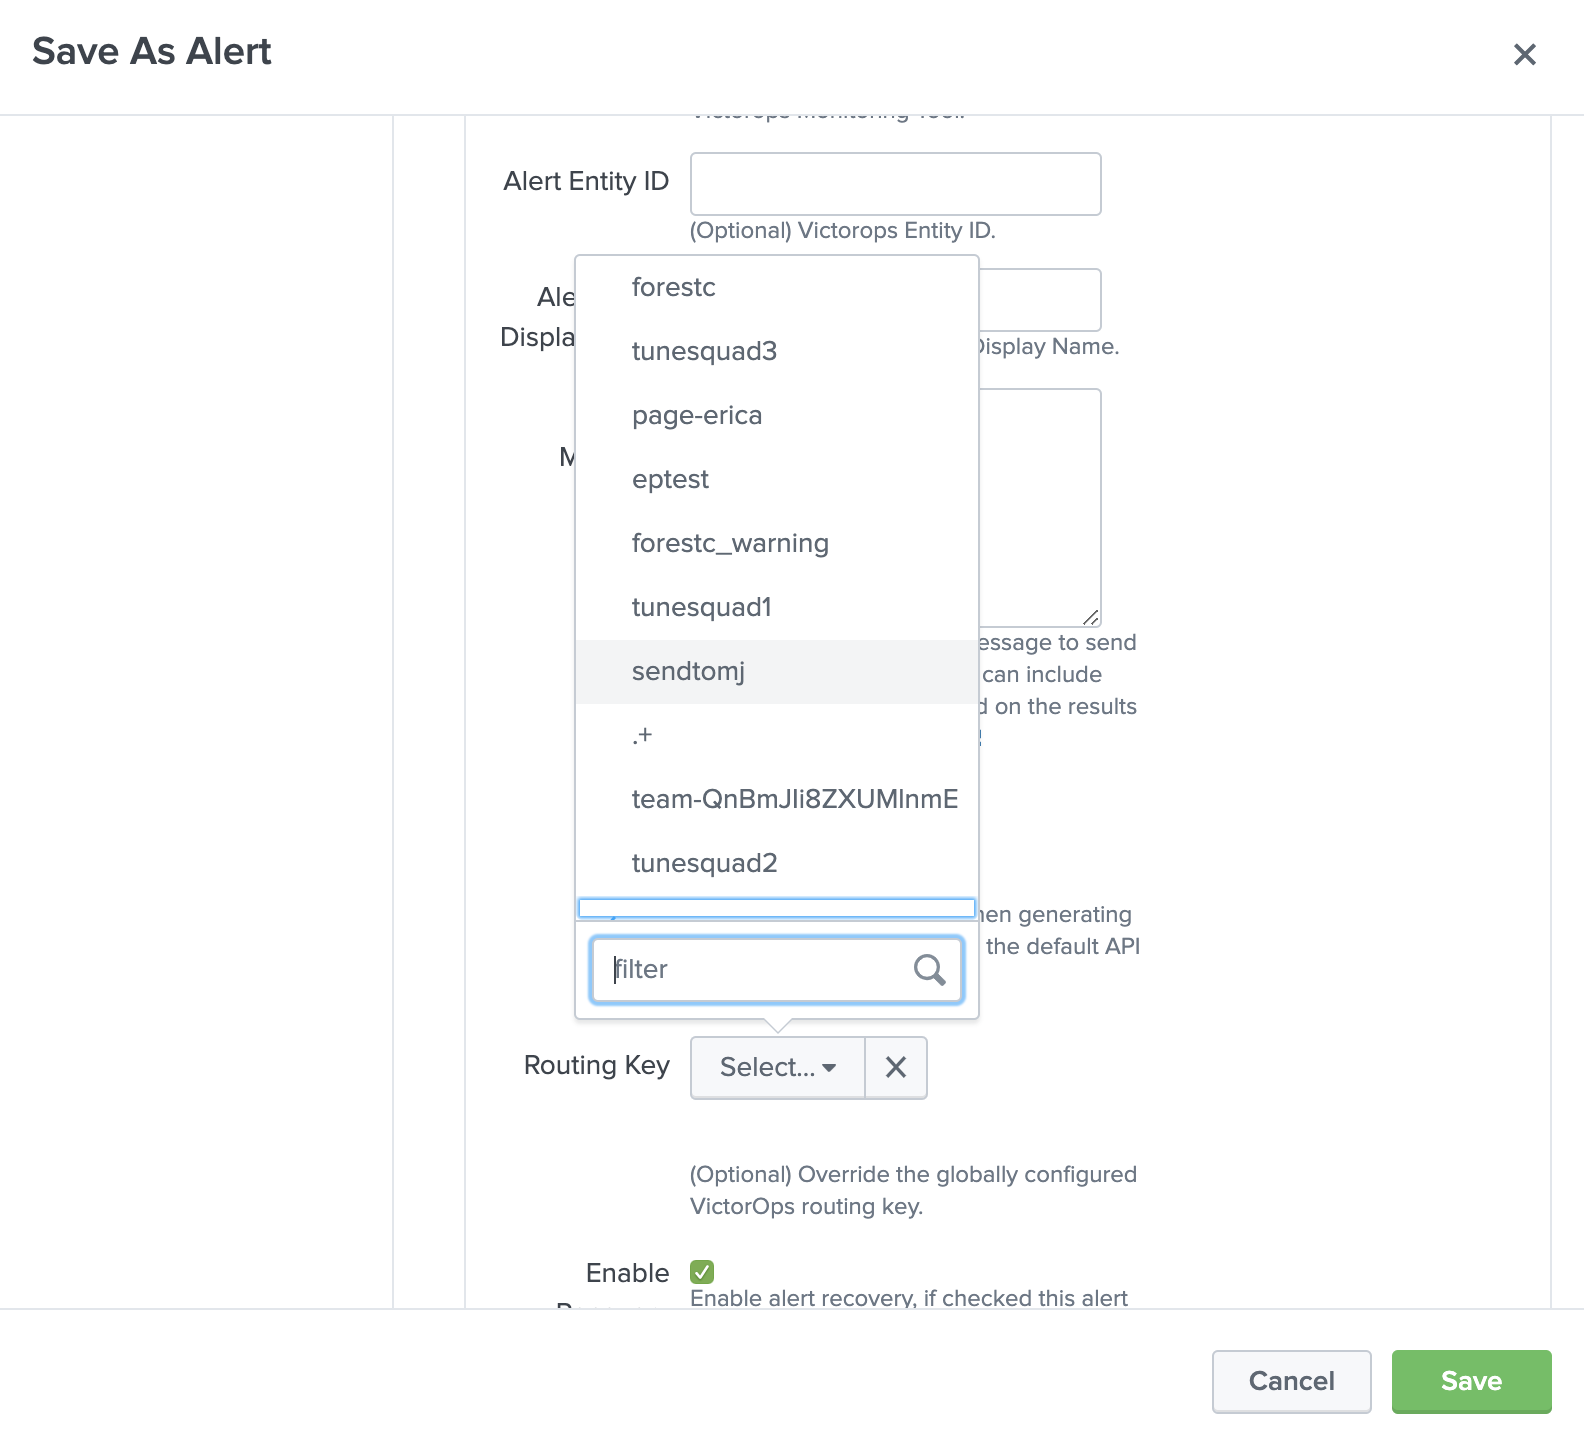
Now, when creating a VictorOps alert action you will see a dropdown of all routing keys within your VictorOps organization.
Configuring VictorOps Alert Actions
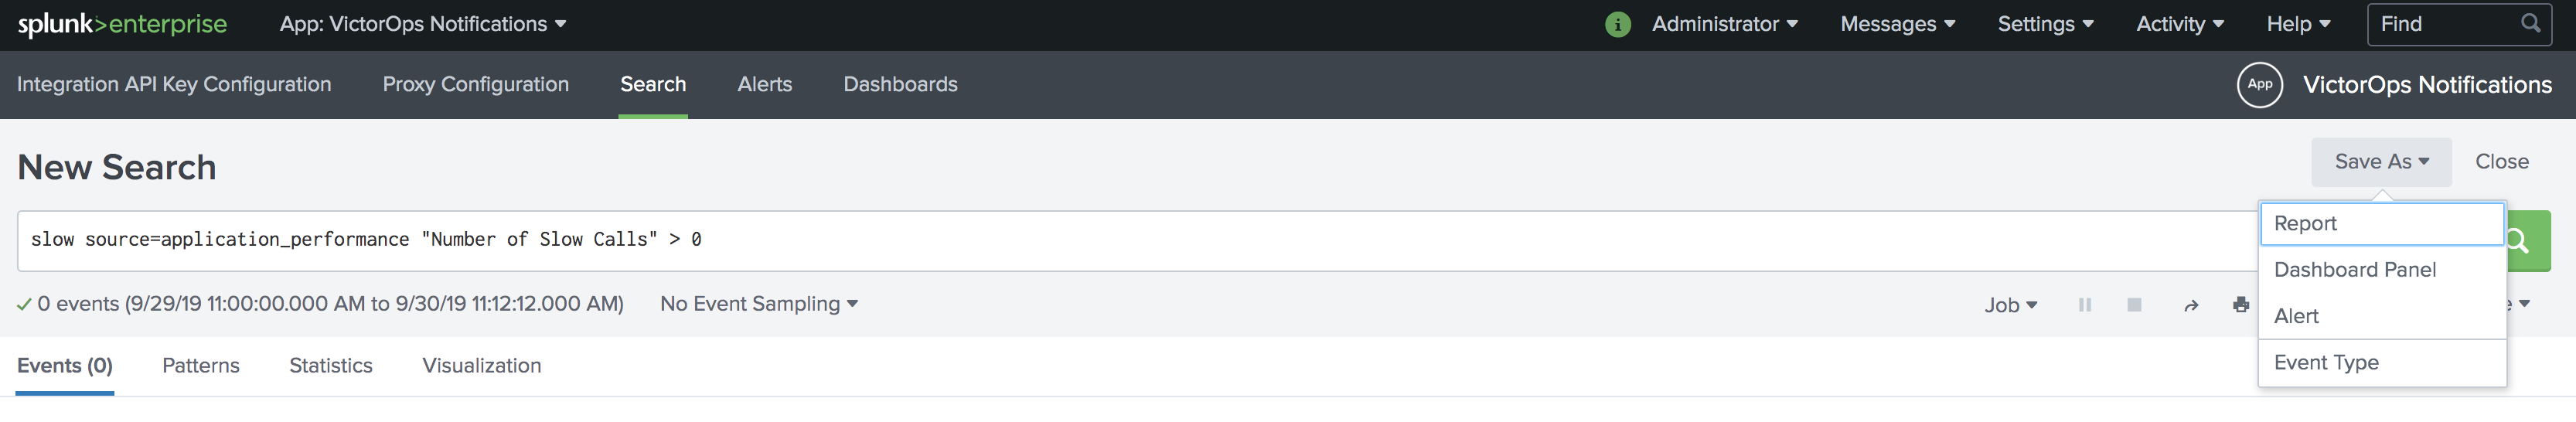
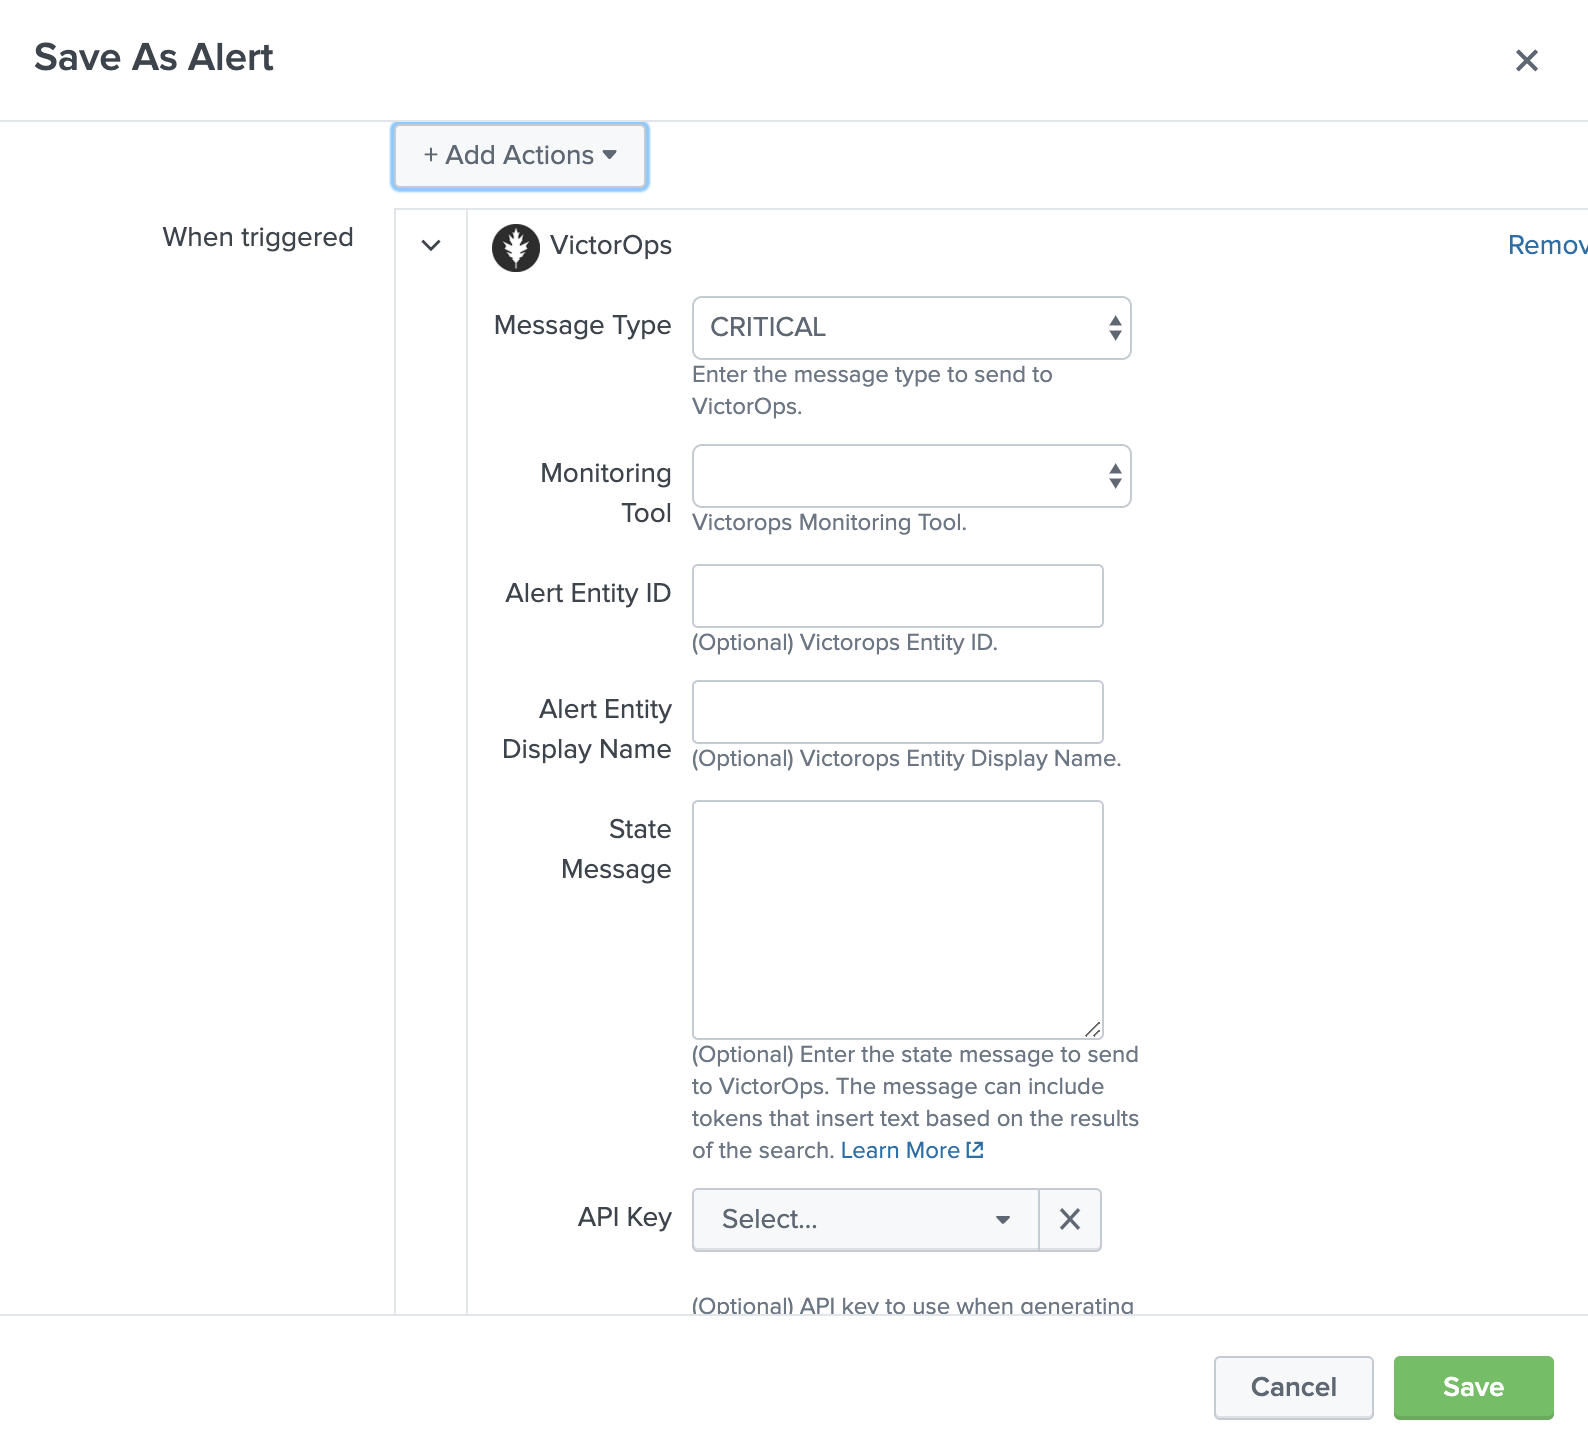
Here is an example of setting up a new alert based on a search. From a new search select Save As, then select Alert.
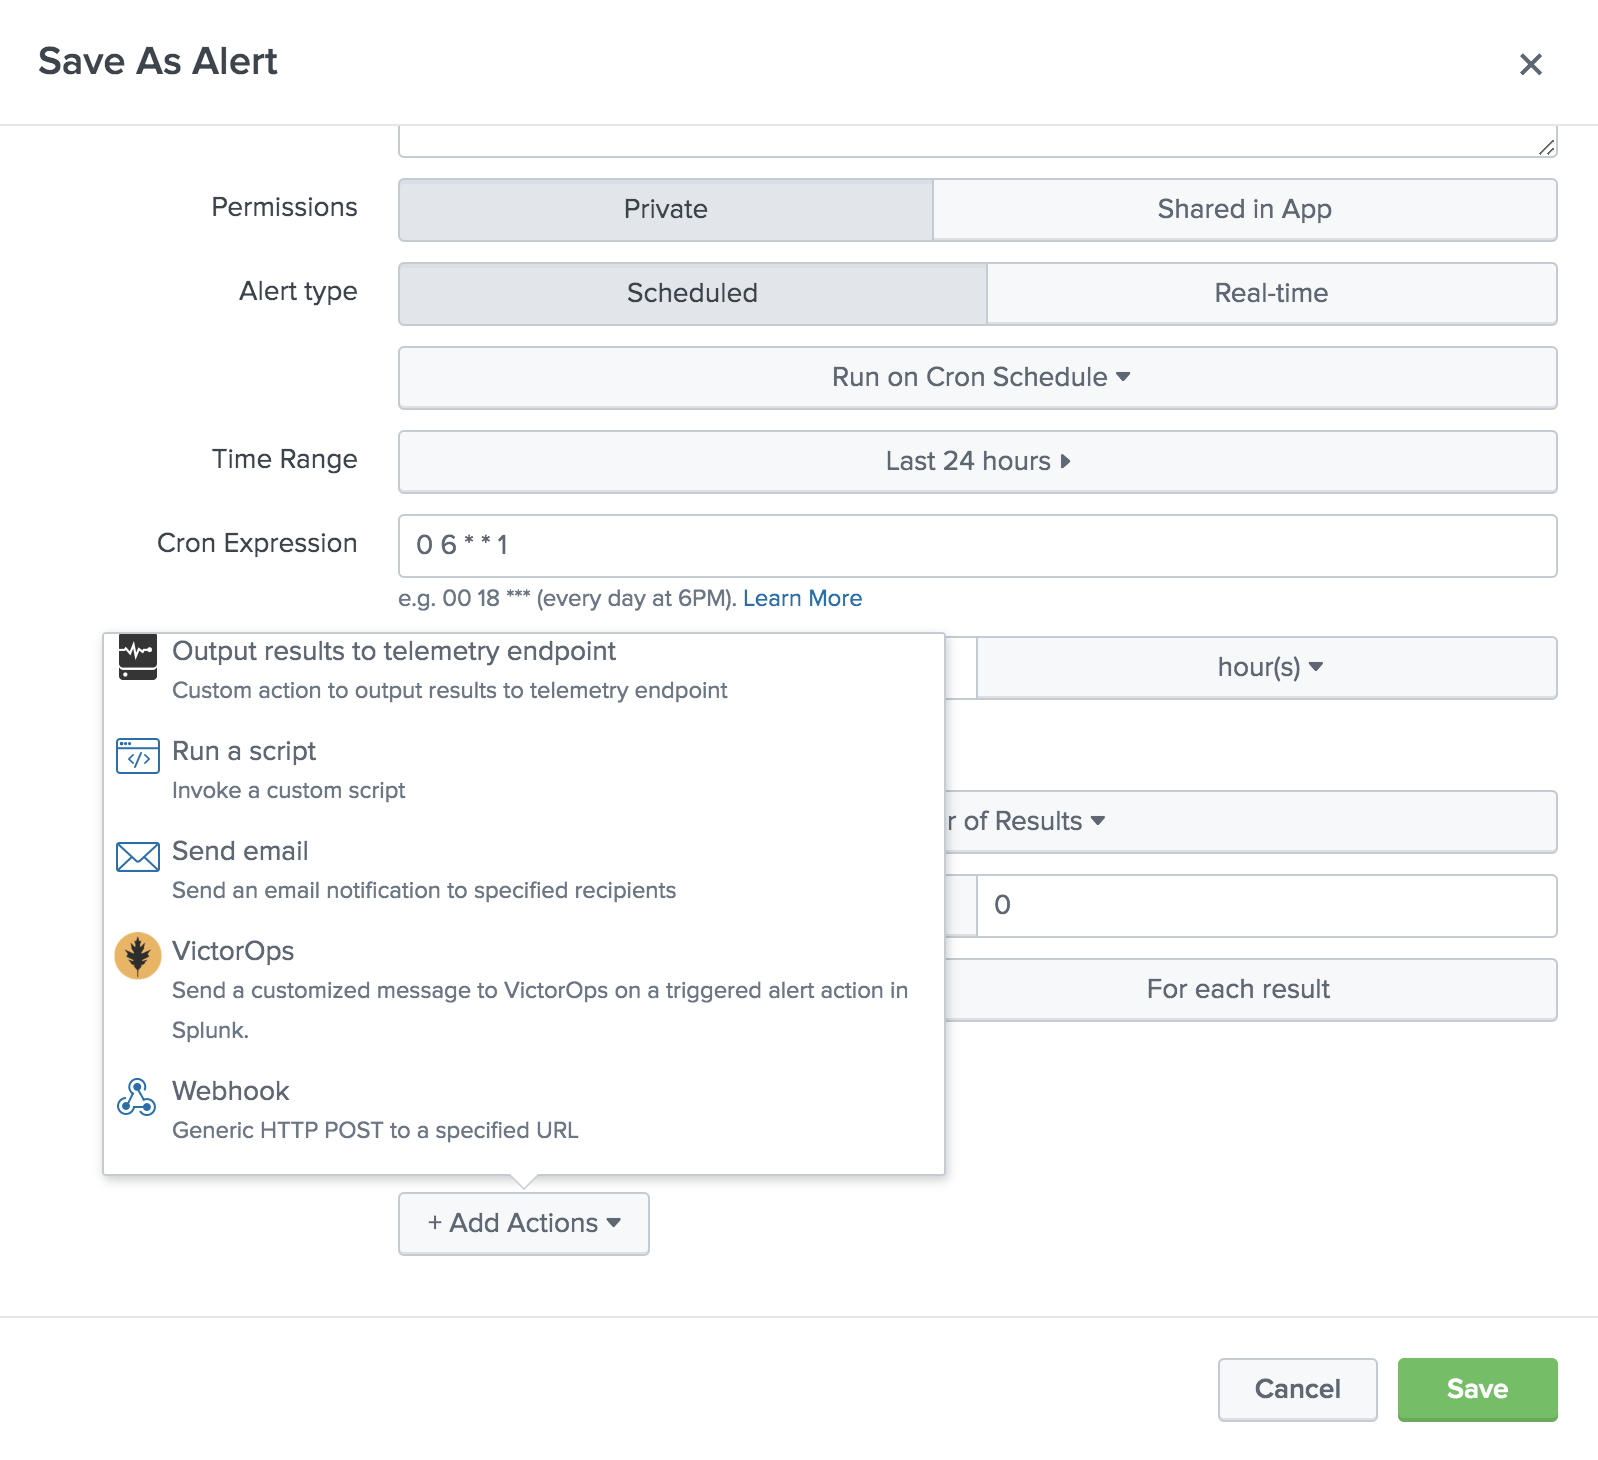
Give the alert a title, description, and permissions as well as configure the check schedule. Under + Add Actions, select VictorOps.
Select the desired message type, and use the state message field to add a brief description of what this particular alert indicates. You may overwrite the default values for entity_id if desired, however, you should understand how best to use this field. If no API key or routing key is selected, alerts will be sent to the default values for these fields. Additionally, you can dynamically reference Splunk fields within these assignments using tokens.
Once the specified conditions are met, you should see an alert appear in your VictorOps timeline.
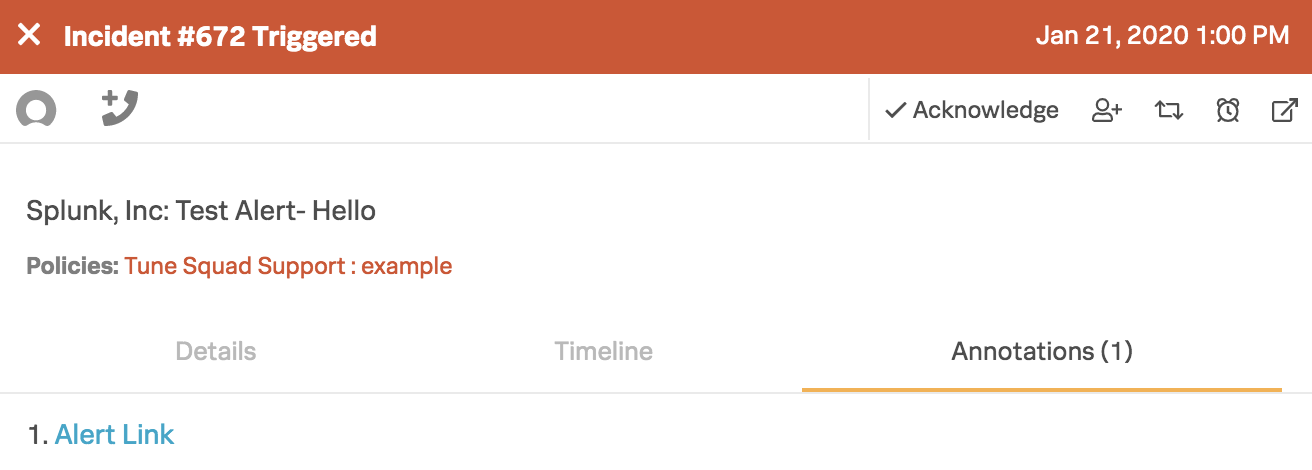
Alert Annotations
In VictorOps, under the Annotations tab in the incident, all Splunk alerts include an alert link that will direct you back to the Splunk alert.
To add other incident annotations please see our Annotations knowledge base.
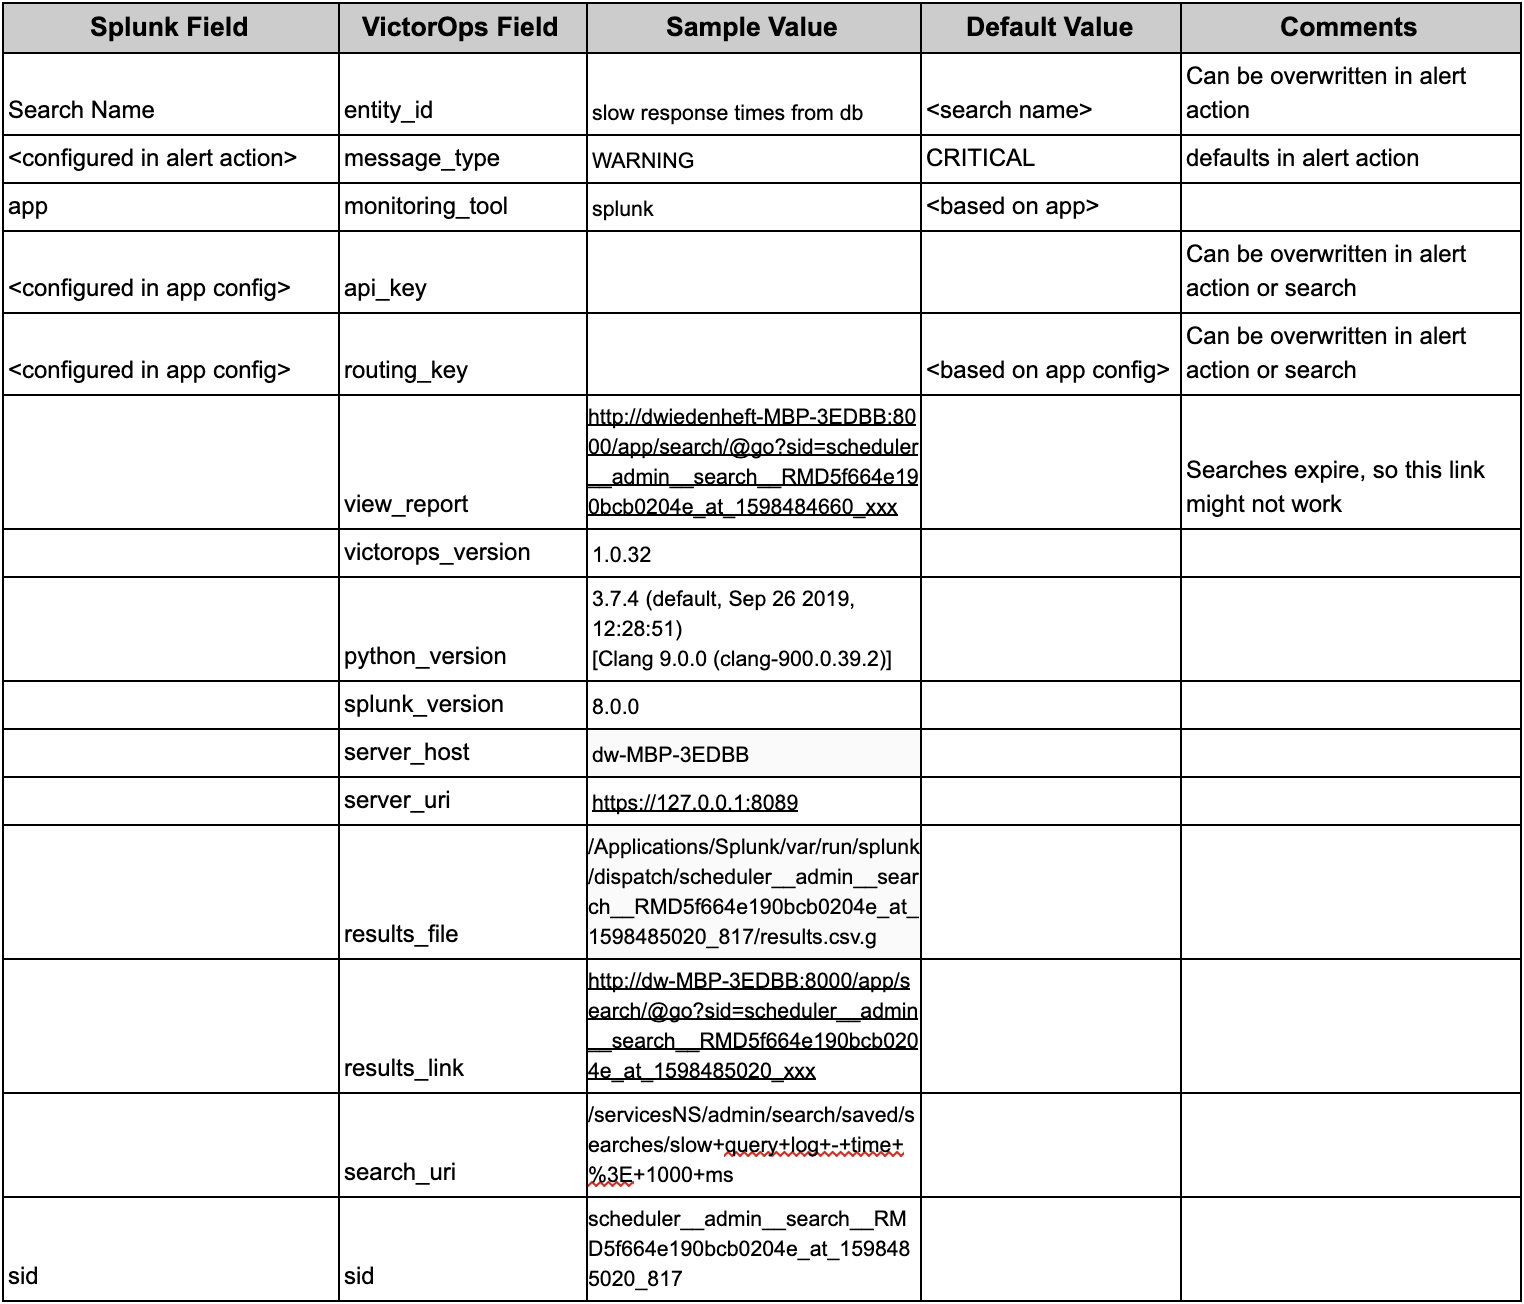
Splunk and VictorOps Mapped Fields
Configuring Splunk Cloud
In VictorOps
From the VictorOps web portal, navigate to Integrations >> 3rd Party Integrations >> Splunk Enterprise then click Enable Integration. Copy the API key to the clipboard to use in later steps.
In Splunk
Under Apps on the left, select +Find More Apps, then in the search bar type VictorOps. Select Install. Once the app is installed it will show up under Apps on the left.
Open up the app and you will be taken to the VictorOps Incident Response Home page which will guide you through setting up the account, configuring API keys, and testing alerts. Once your configuration is complete you will see a check next to each configuration step.
Alert API Key Configuration
On the Alert API Key Configuration page, paste the API key copied earlier, along with any desired routing key from your VictorOps organization. If the routing key is left blank, alerts will be routed to your default routing key. You will also be able to access your API key by clicking the VictorOps Splunk Integration link.
Data API Configuration & Routing Keys
For versions 1.0.21 and above you will now be able to add your VictorOps API ID and API Key, found in VictorOps under Integrations >>> API, to retrieve routing keys within VictorOps. If you have yet to generate your API key and ID, please enable and generate your orgs key and ID.
Once the API Key and API ID have been saved, click Retrieve Routing Keys to retrieve the most up to date list of your organizations routing keys.
Now, when creating a VictorOps alert action you will see a dropdown of all routing keys within your VictorOps organization.
Testing Configuration
Once API is saved you will be able to verify the integration by selecting Test under actions. You will see success as well as an alert in your VictorOps timeline.
NOTE: This test alert will not be an Incident in your org as it is an INFO alert. To find this test alert, you’ll want to look in your Timeline instead of the Incidents tab.
Also, from the Search app in Splunk, you can directly type
| sendalert victorops param.message_type="INFO"
to send a test alert directly to your VictorOps timeline. To create an incident, simply change INFO to CRITICAL. If you have any questions, please contact VictorOps Support.
VictorOps can now be used as an Alert Action.
Configuring VictorOps Alert Actions
Here is an example of setting up a new alert based on a search. From a new search select Save As, then select Alert.
Give the alert a title, description, and permissions as well as configure the check schedule. Under + Add Actions, select VictorOps.
Select the desired message type, and use the state message field to add a brief description of what this particular alert indicates. You may overwrite the default values for entity_id if desired, however, you should understand how best to use this field. If no API key or routing key is selected, alerts will be sent to the default values for these fields. Additionally, you can dynamically reference Splunk fields within these assignments using tokens.
Once the specified conditions are met, you should see an alert appear in your VictorOps timeline.
Alert Annotations
In VictorOps, under the Annotations tab in the incident, all Splunk alerts include an alert link that will direct you back to the Splunk alert.
To add other incident annotations please see our Annotations knowledge base.
Advanced Configurations
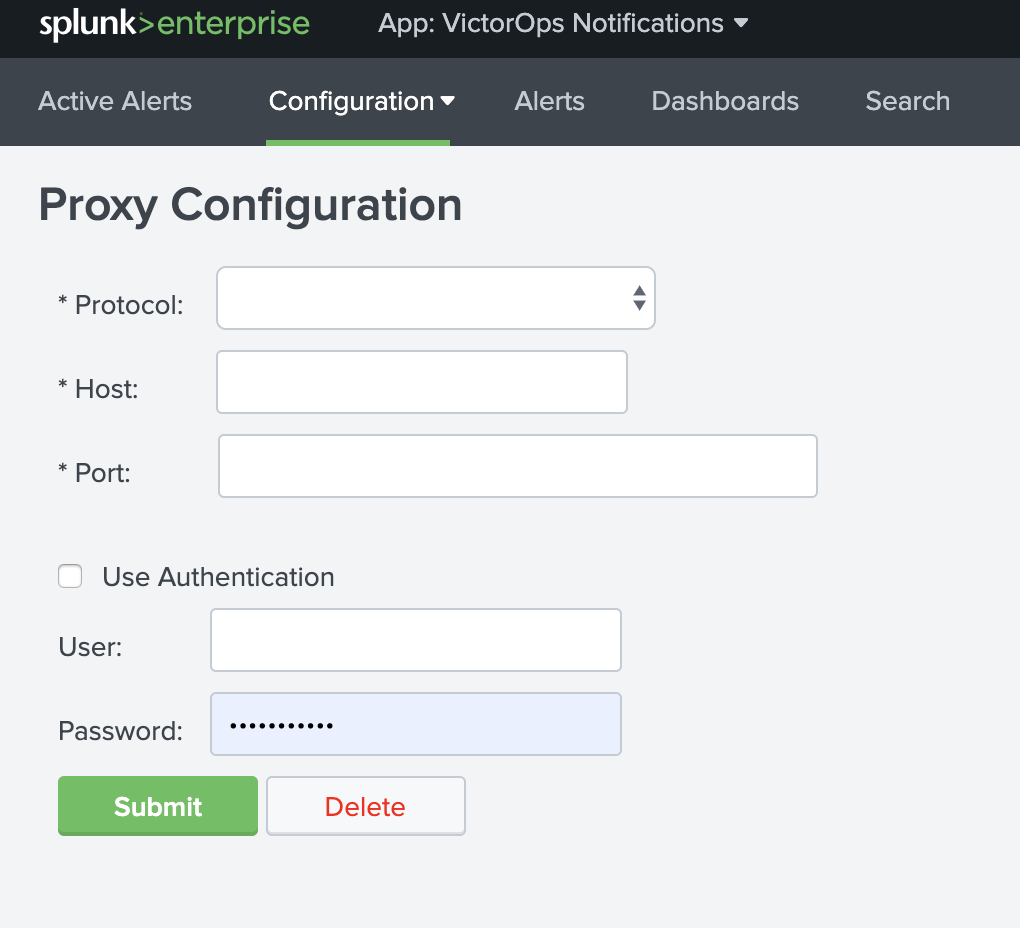
Proxy Configuration
A proxy configuration can be enabled for the integration by navigating to Configuration >>> Proxy Configuration
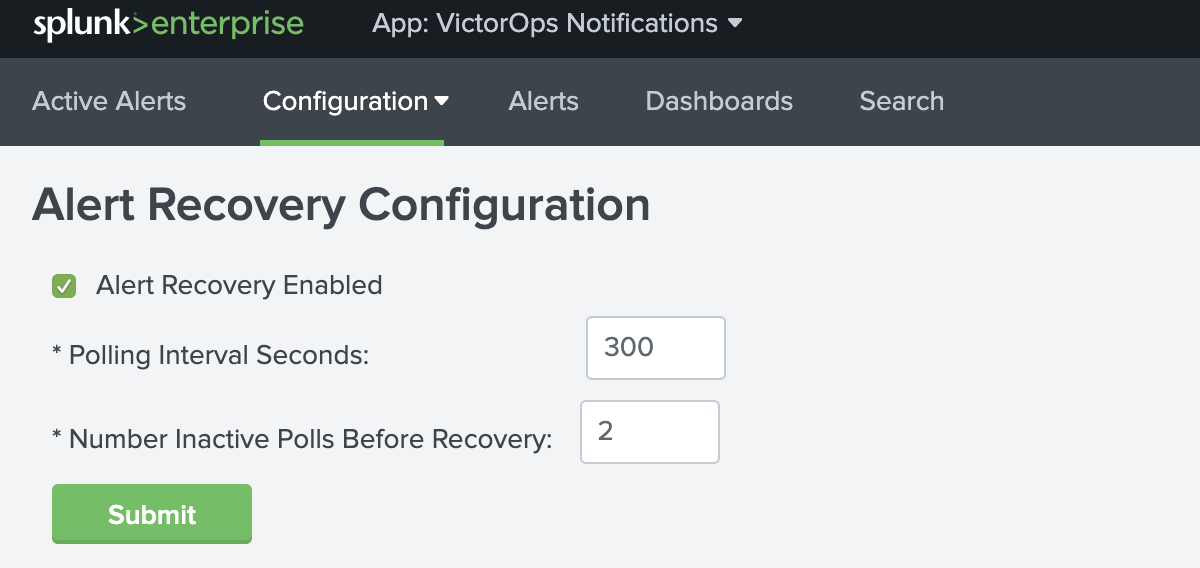
Alert Recovery Configuration
Once the Splunk for VictorOps app is enabled (1.0.18 and above) the Alert Recovery checkbox will be globally defaulted ON. The alert recovery checkbox can also be configured at the individual alert level for a more granular setting.
In the global recovery configuration, you are able to configure the polling interval (in seconds) as well as the number of inactive polls before sending a recovery. Below are the global default settings for Alert Recoveries.
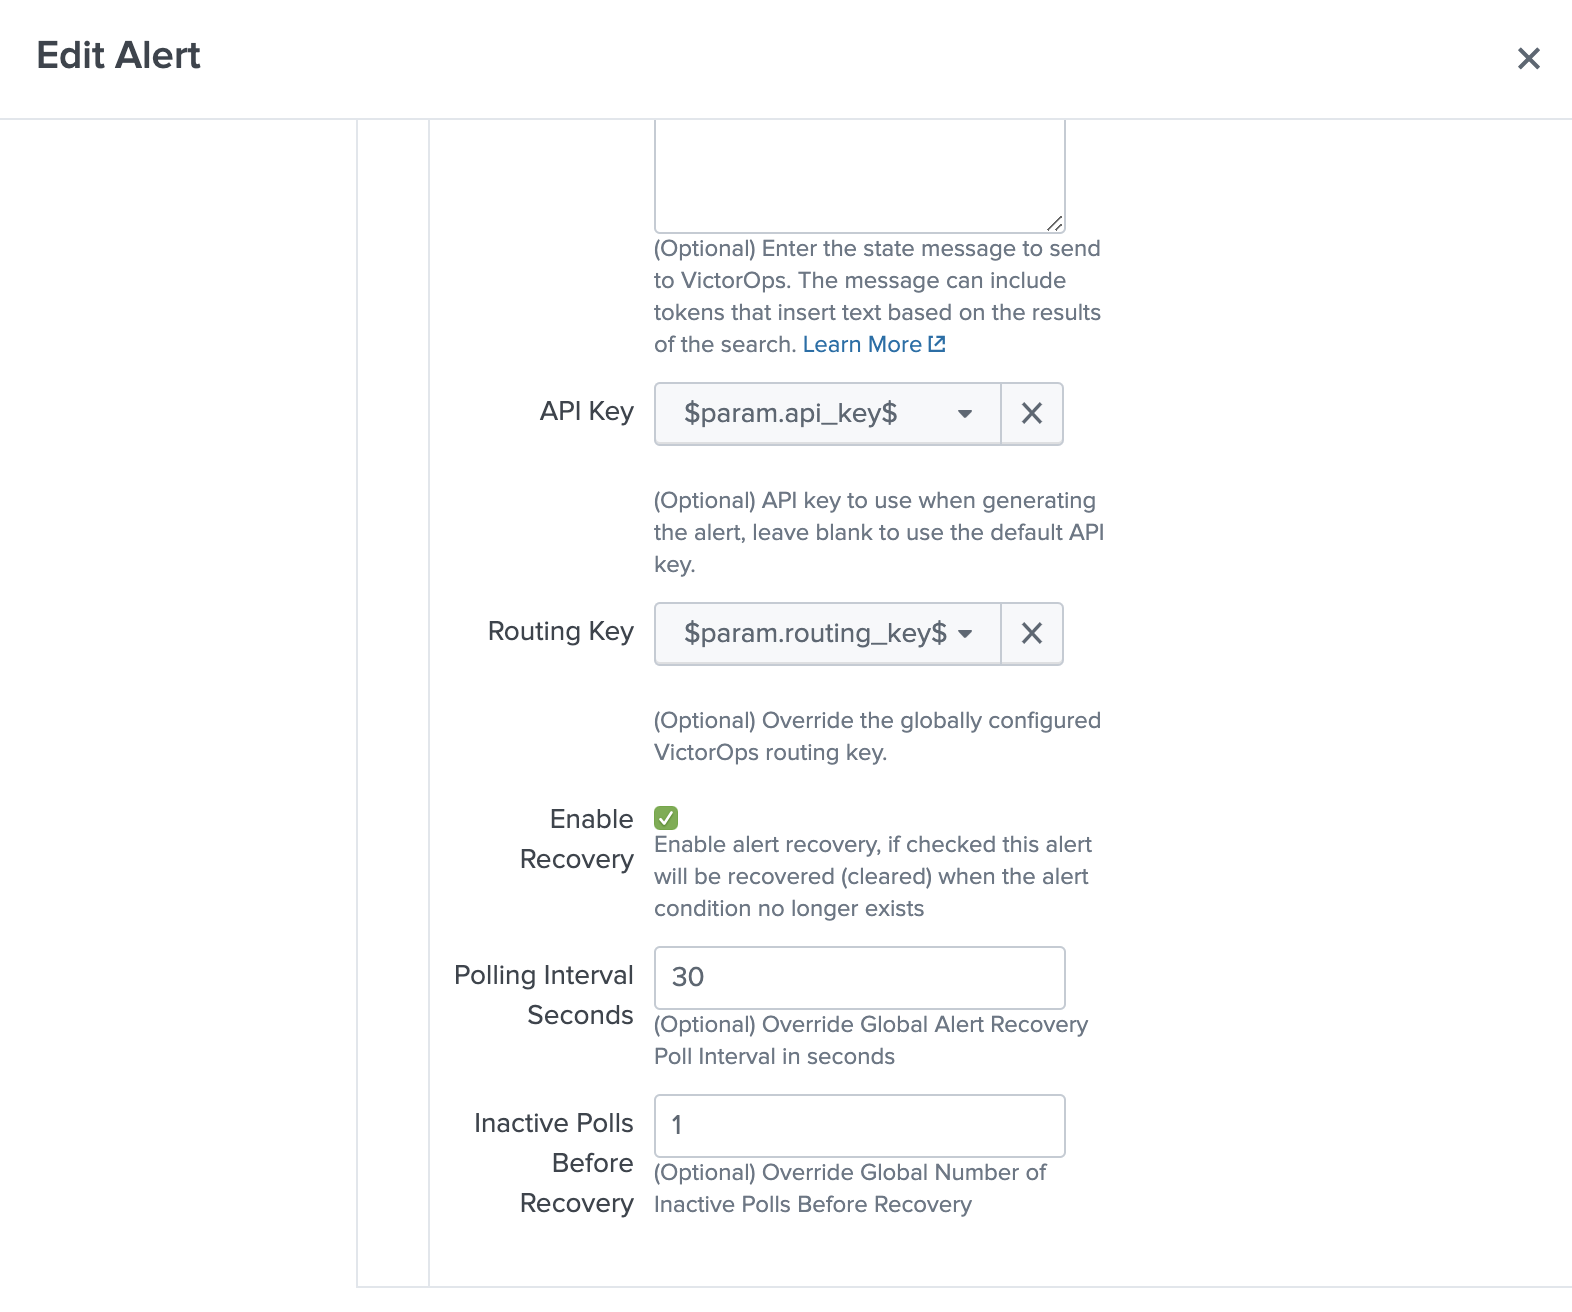
At the individual alert level, under the VictorOps Trigger Actions, you can find the ‘Enable Recovery’ checkbox for the more granular setting. For versions 1.0.25 and above you are able to set the Polling Interval as well as Inactive Poll count for each individual alert.
IMPORTANT NOTE: Alert specific recovery settings must be greater than the global recovery settings.
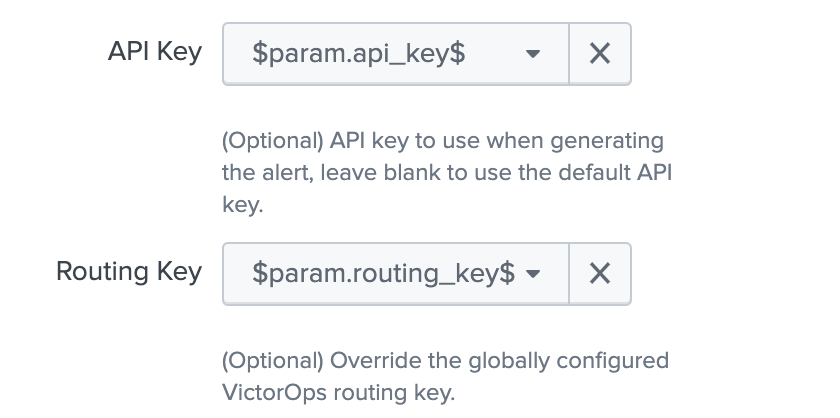
Dynamically Setting the API Key & Routing Key via Search
Versions 1.0.25 and above you are now able to set the API key as well as the Routing key in the Search.
Below is an example of the format needed for the dynamic values.
<alert search> | eval 'param.api_key'="xxxxxxxxxx" | eval 'param.routing_key'="xxx"
When creating the VictorOps trigger action with dynamically pulled values from your search, you will select the param.api_key as the API Key for the alerts as well as param.routing_key as the Routing Key for the alert.
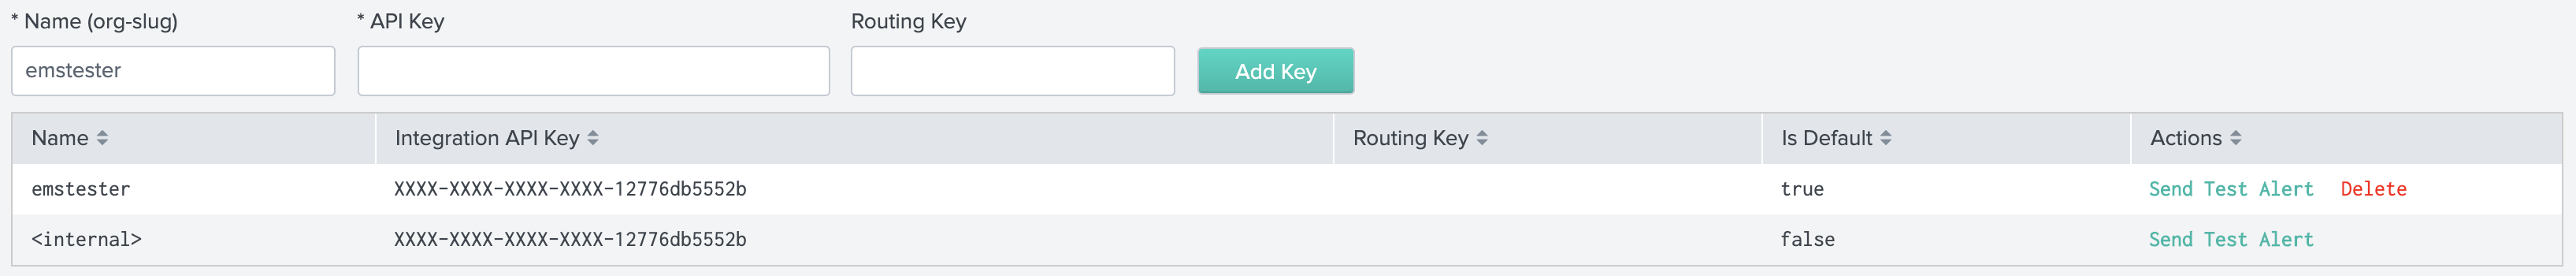
Any dynamic keys used in a Search will be added as in <internal> key in your Alert API Key Configuration.
Search Head Cluster Set-Up
Before running Splunk for VictorOps with search heads please make sure that there is a deployer as well as (at least) 3 search heads.
Below are the steps to take when using the Splunk for VictorOps app with search head clusters.
1. Install the latest version of the Splunk for VictorOps app on the deployer via the UI
2. Push out to the search head by running ./bin/splunk apply shcluster-bundle -target https://sh1:8089 -auth username:password
3. Configure the Integration API key on one search head
4. The Integration API key will get automatically replicated to the other search head nodes
5. Test with the Test button on each search head to verify
Splunk ITSI
About VictorOps and Splunk ITSI
With the VictorOps and Splunk ITSI integration, you can leverage Splunk’s data and log analysis capabilities to correlate multiple incidents into single event groups and easily send alerts into VictorOps. Then, teammates can collaborate in-line with monitoring data inside the VictorOps timeline to speed up incident response and remediation.
Predictive Analytics and Collaborative Incident Response
- Splunk ITSI’s machine learning lets you correlate multiple alerts into a single event, limiting alert fatigue for incidents sent into VictorOps
- Easily trigger alerts to be sent into VictorOps from a simple drop-down in Splunk’s alert actions menu
- Centralize incident details and communication in the VictorOps timeline to help teams collaborate and add transparency to incident management workflows
- Monitor your entire infrastructure, compile the data in Splunk ITSI, and keep an eye on overall system health–sometimes predicting potential incidents before they happen
- Manage on-call schedules, alert routing rules, and escalation policies in one place, ensuring the right person receives contextual alerts at the right time
- Conduct thorough post-incident reviews with a detailed history of events and communication throughout an incident’s lifespan.
This is documentation for integrating Splunk ITSI (IT Service Intelligence) with your VictorOps account. Splunk ITSI is a powerful AI-powered monitoring and analytics solution that allows for incident prediction and prevention.
Requirements
Versions Supported: Splunk ITSI 4.0 or newer
VictorOps for Splunk: available in the splunkbase HERE.
For more information check out the splunkbase documentation
In VictorOps (ITSI)
From the VictorOps web portal, navigate to Integrations >> 3rd Party Integrations >> Splunk ITSI then click Enable Integration. Copy the API key to the clipboard to use in later steps.
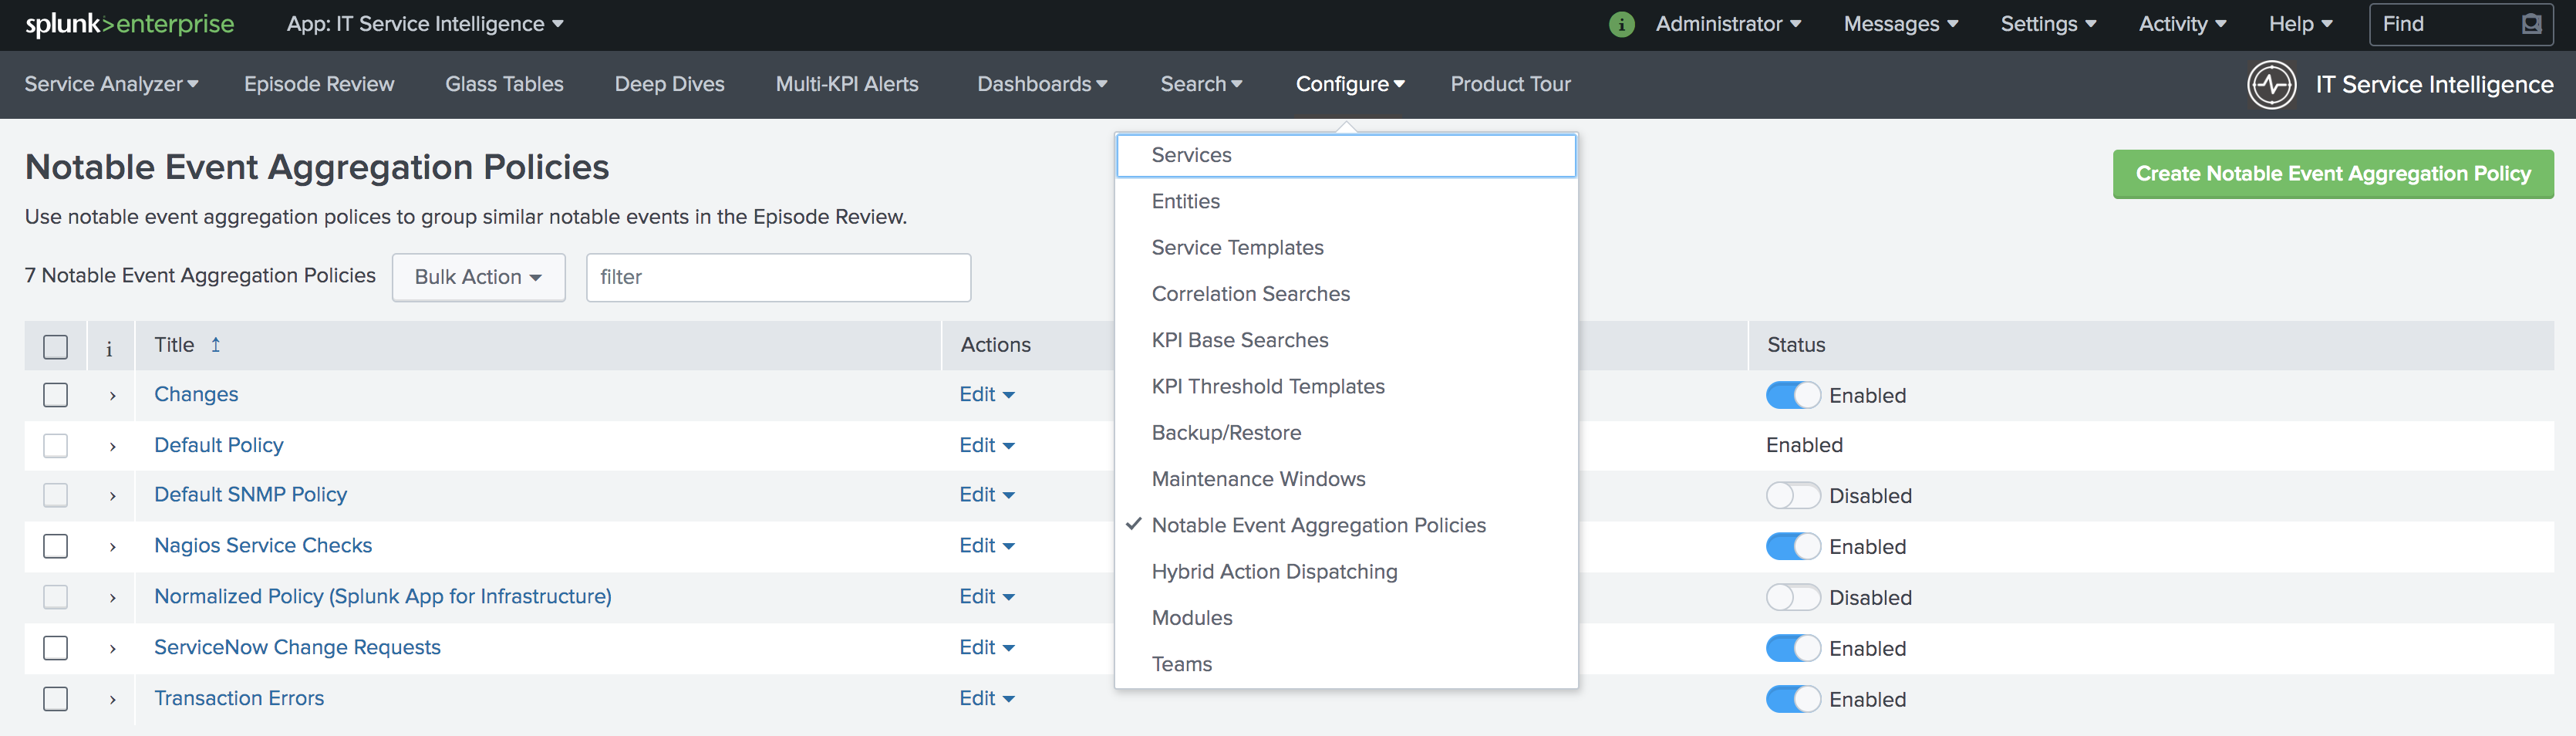
In Splunk ITSI Notable Event Aggregation Policies
Navigate to Configure >> Notable Events Aggregation Policies and click the name of the Aggregation Policy you want to alert VictorOps.
In the Action Rules tab, set your trigger conditions then choose VictorOps and configure your alert accordingly.
Note: Keep the Alert Entity ID consistent for all Message Types (leave blank for default) across related actions. VictorOps uses this field to identify incidents and correlate subsequent alerts with the original incident. Once configured correctly, ITSI will automatically create a VictorOps incident.
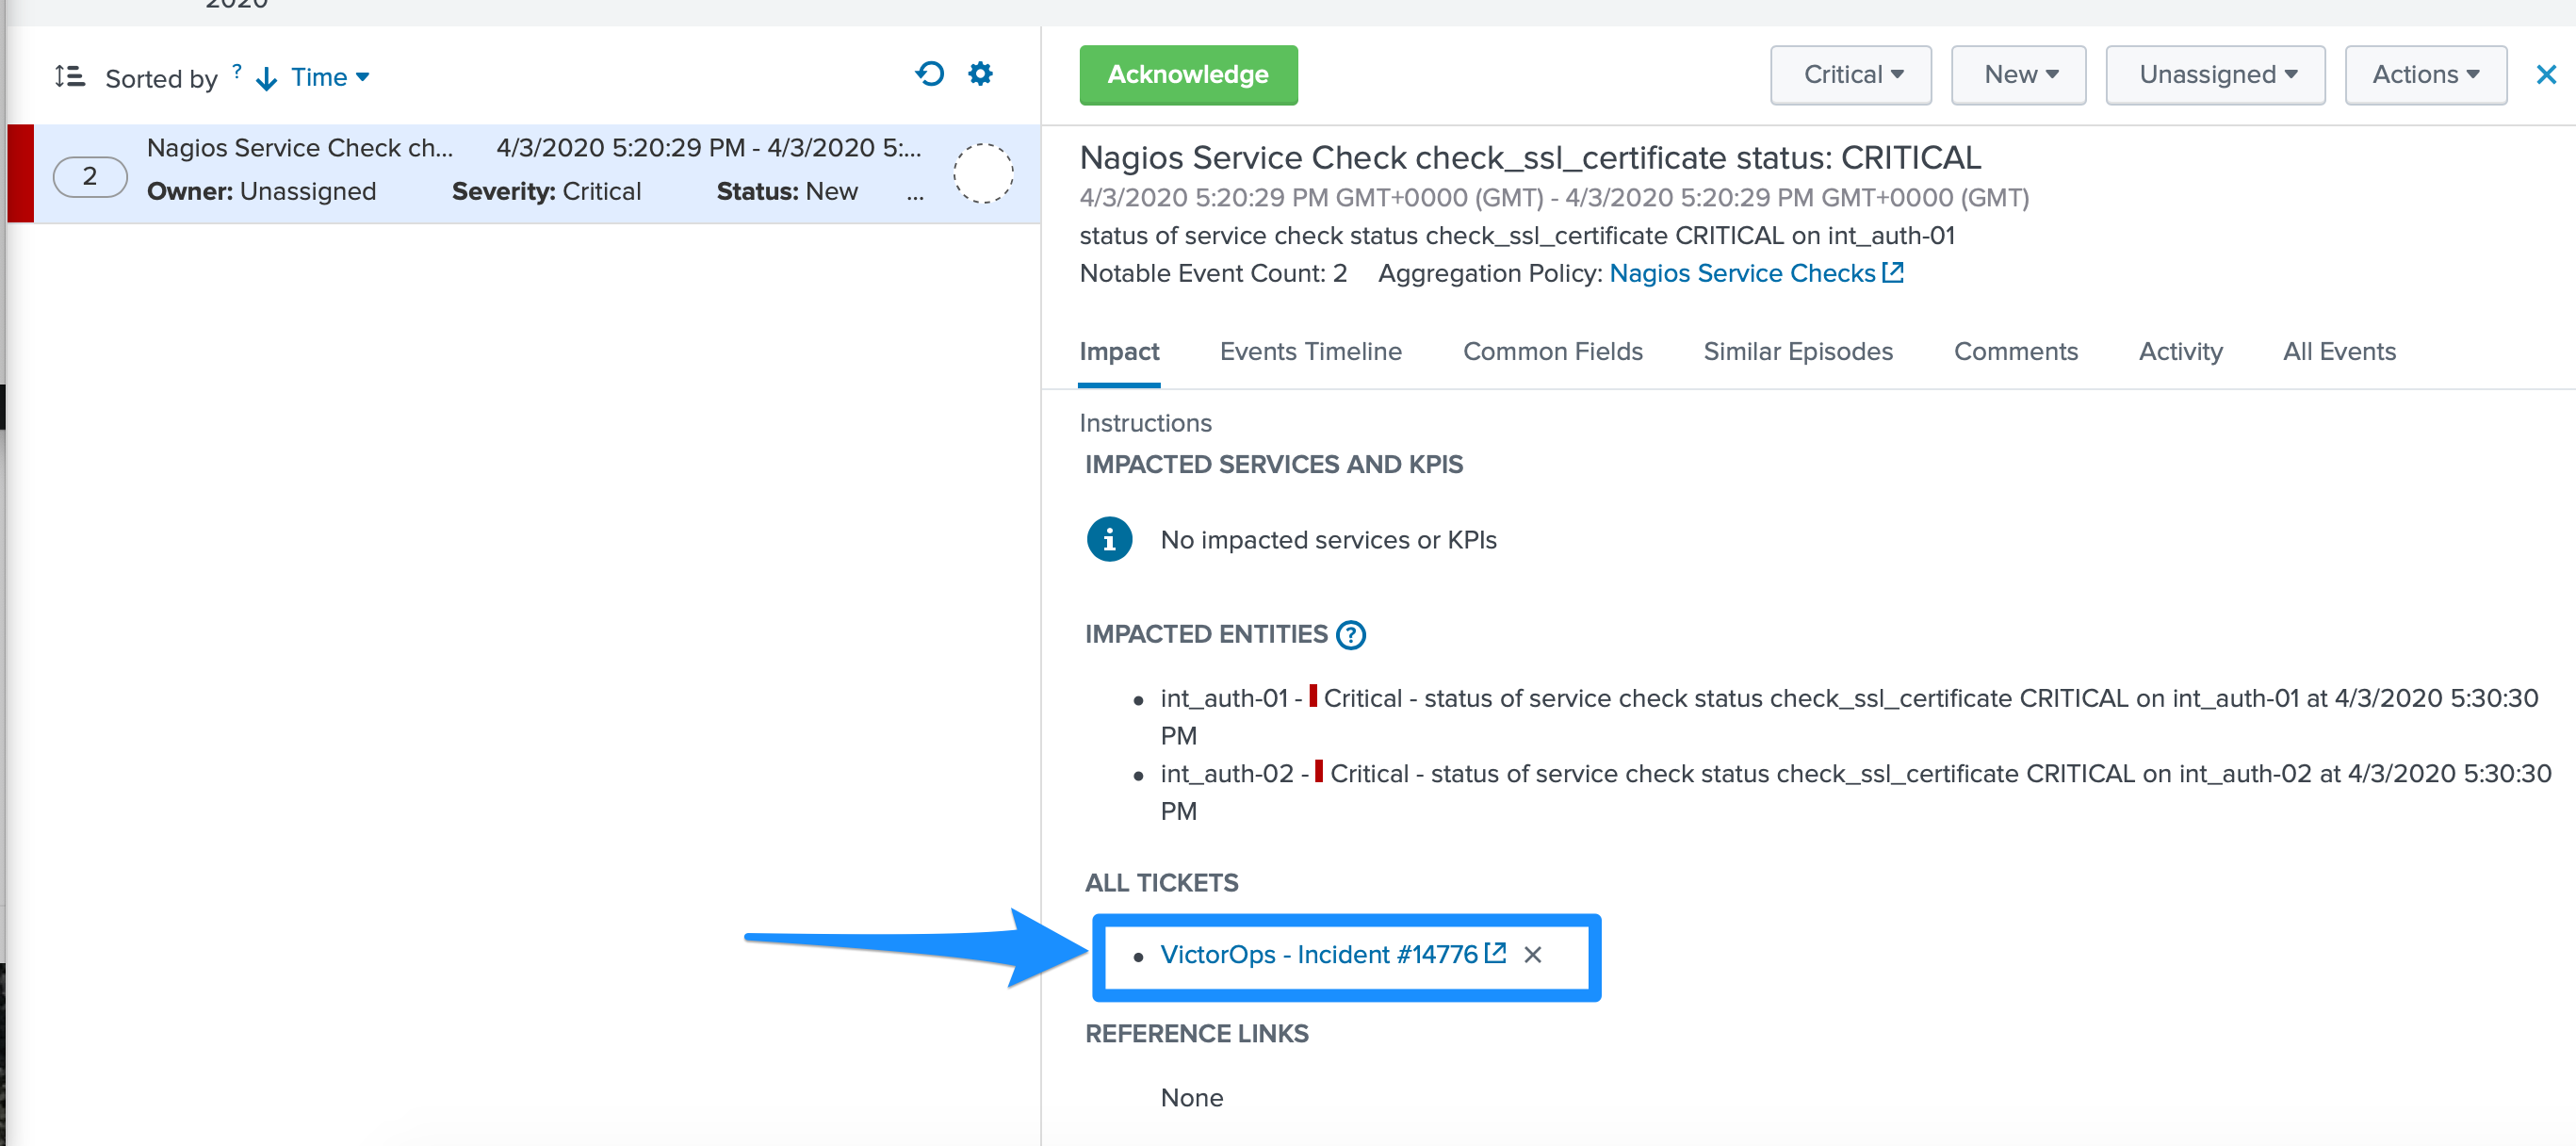
Versions 1.0.22 and above, when you create a VictorOps incident from ITSI, the Ticket number will now show up in the ITSI Episode Review.
To Create a VictorOps Incident
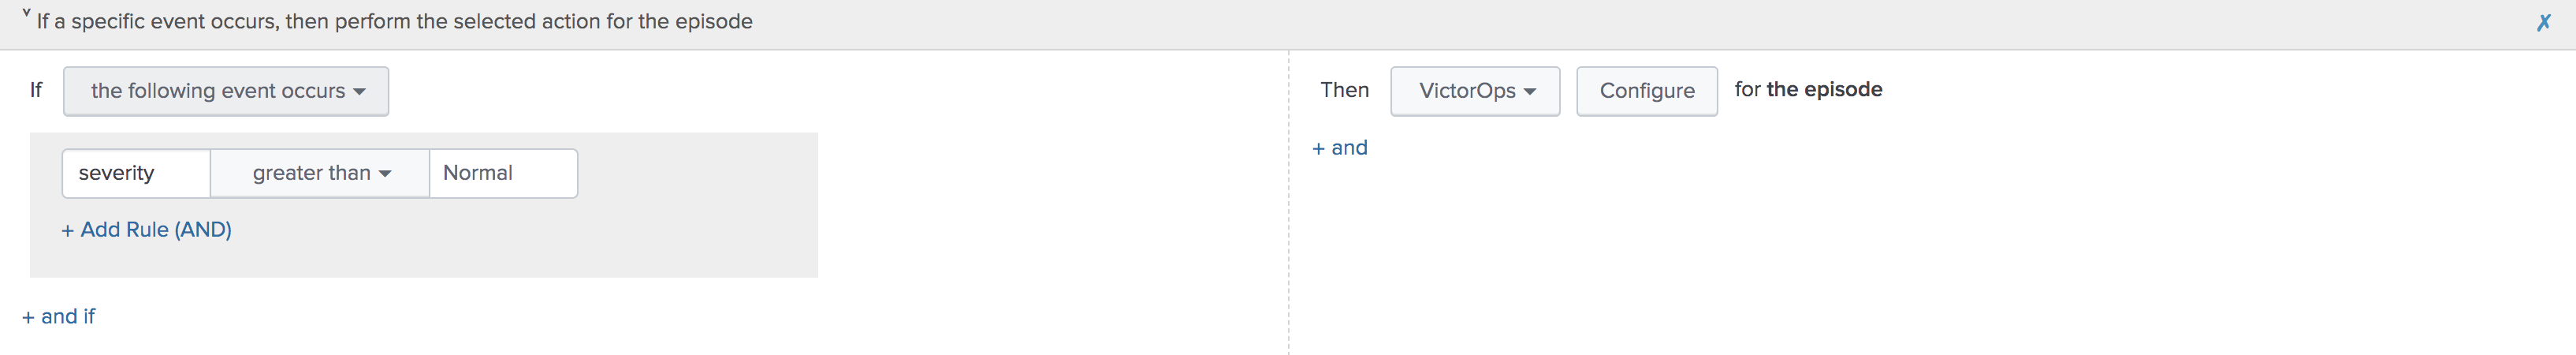
Navigate to the Action Rules tab for the desired Aggregation Policy. For an action to create an incident in VictorOps, set the conditions to if the following event occurs: severity greater than Normal then select VictorOps and click Configure.
The monitoring tool field and message type are the only fields that need to be set otherwise the rest of the fields will use default values. The default values are:
- Message Type : CRITICAL (set this value)
- Monitoring Tool: splunk-itsi (set this value)
- Alert Entity ID: $result.itsi_group_id$
- Alert Entity Display Name: $result.itsi_group_title$
- State Message: $result.itsi_group_title$
- Routing Key: default routing key (unless specified otherwise)
- This functionality requires the “Data API Keys” and organization name to be set up in the VictorOps for Splunk app.
- From ITSI: you will be able to see if there is an associated Incident to the ticket.
- From VictorOps: this will allow for easy access back to the ITSI Filtered Episode Review or Overall Episode Review via annotations.
To Resolve a VictorOps Incident
Within the same Aggregation Policy, navigate to the Action Rules tab. To resolve the episode in ITSI, select change status to Resolved. To resolve the corresponding incident in VictorOps, set the conditions to if the episode is broken, then VictorOps and click Configure.
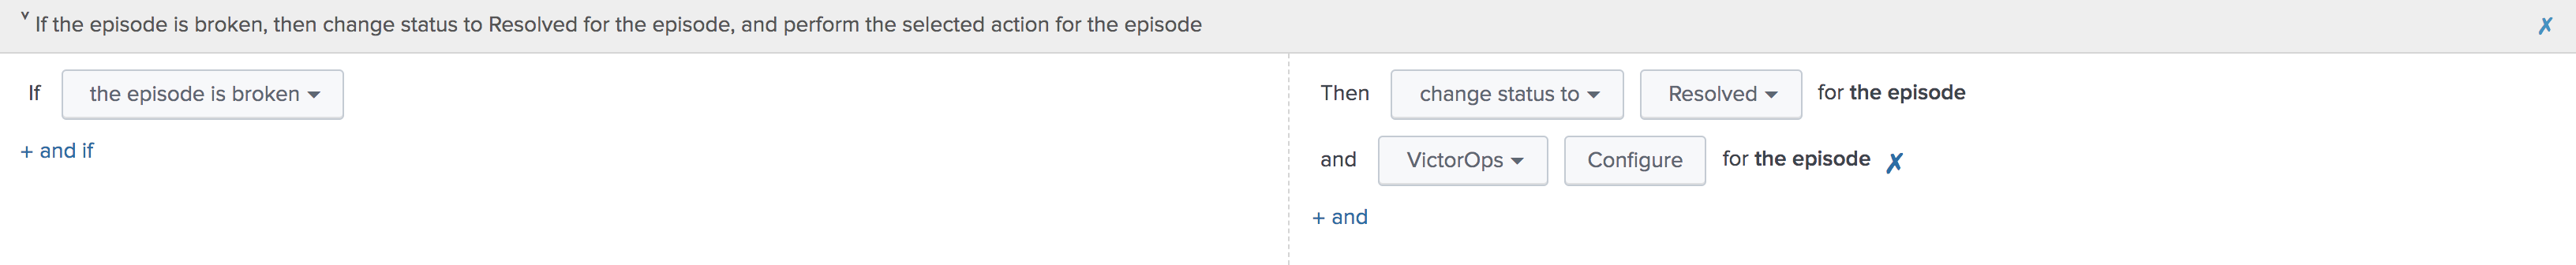
Configure the action making sure to select RECOVERY as the message type and ITSI as the monitoring tool, other values will be default values. The Alert Entity ID should be same as the initial alert so that VictorOps resolves the corresponding incident if default values are used.
To Acknowledge a VictorOps Incident Manually
Navigate to Episode Review then click the desired episode, Actions, and select VictorOps.
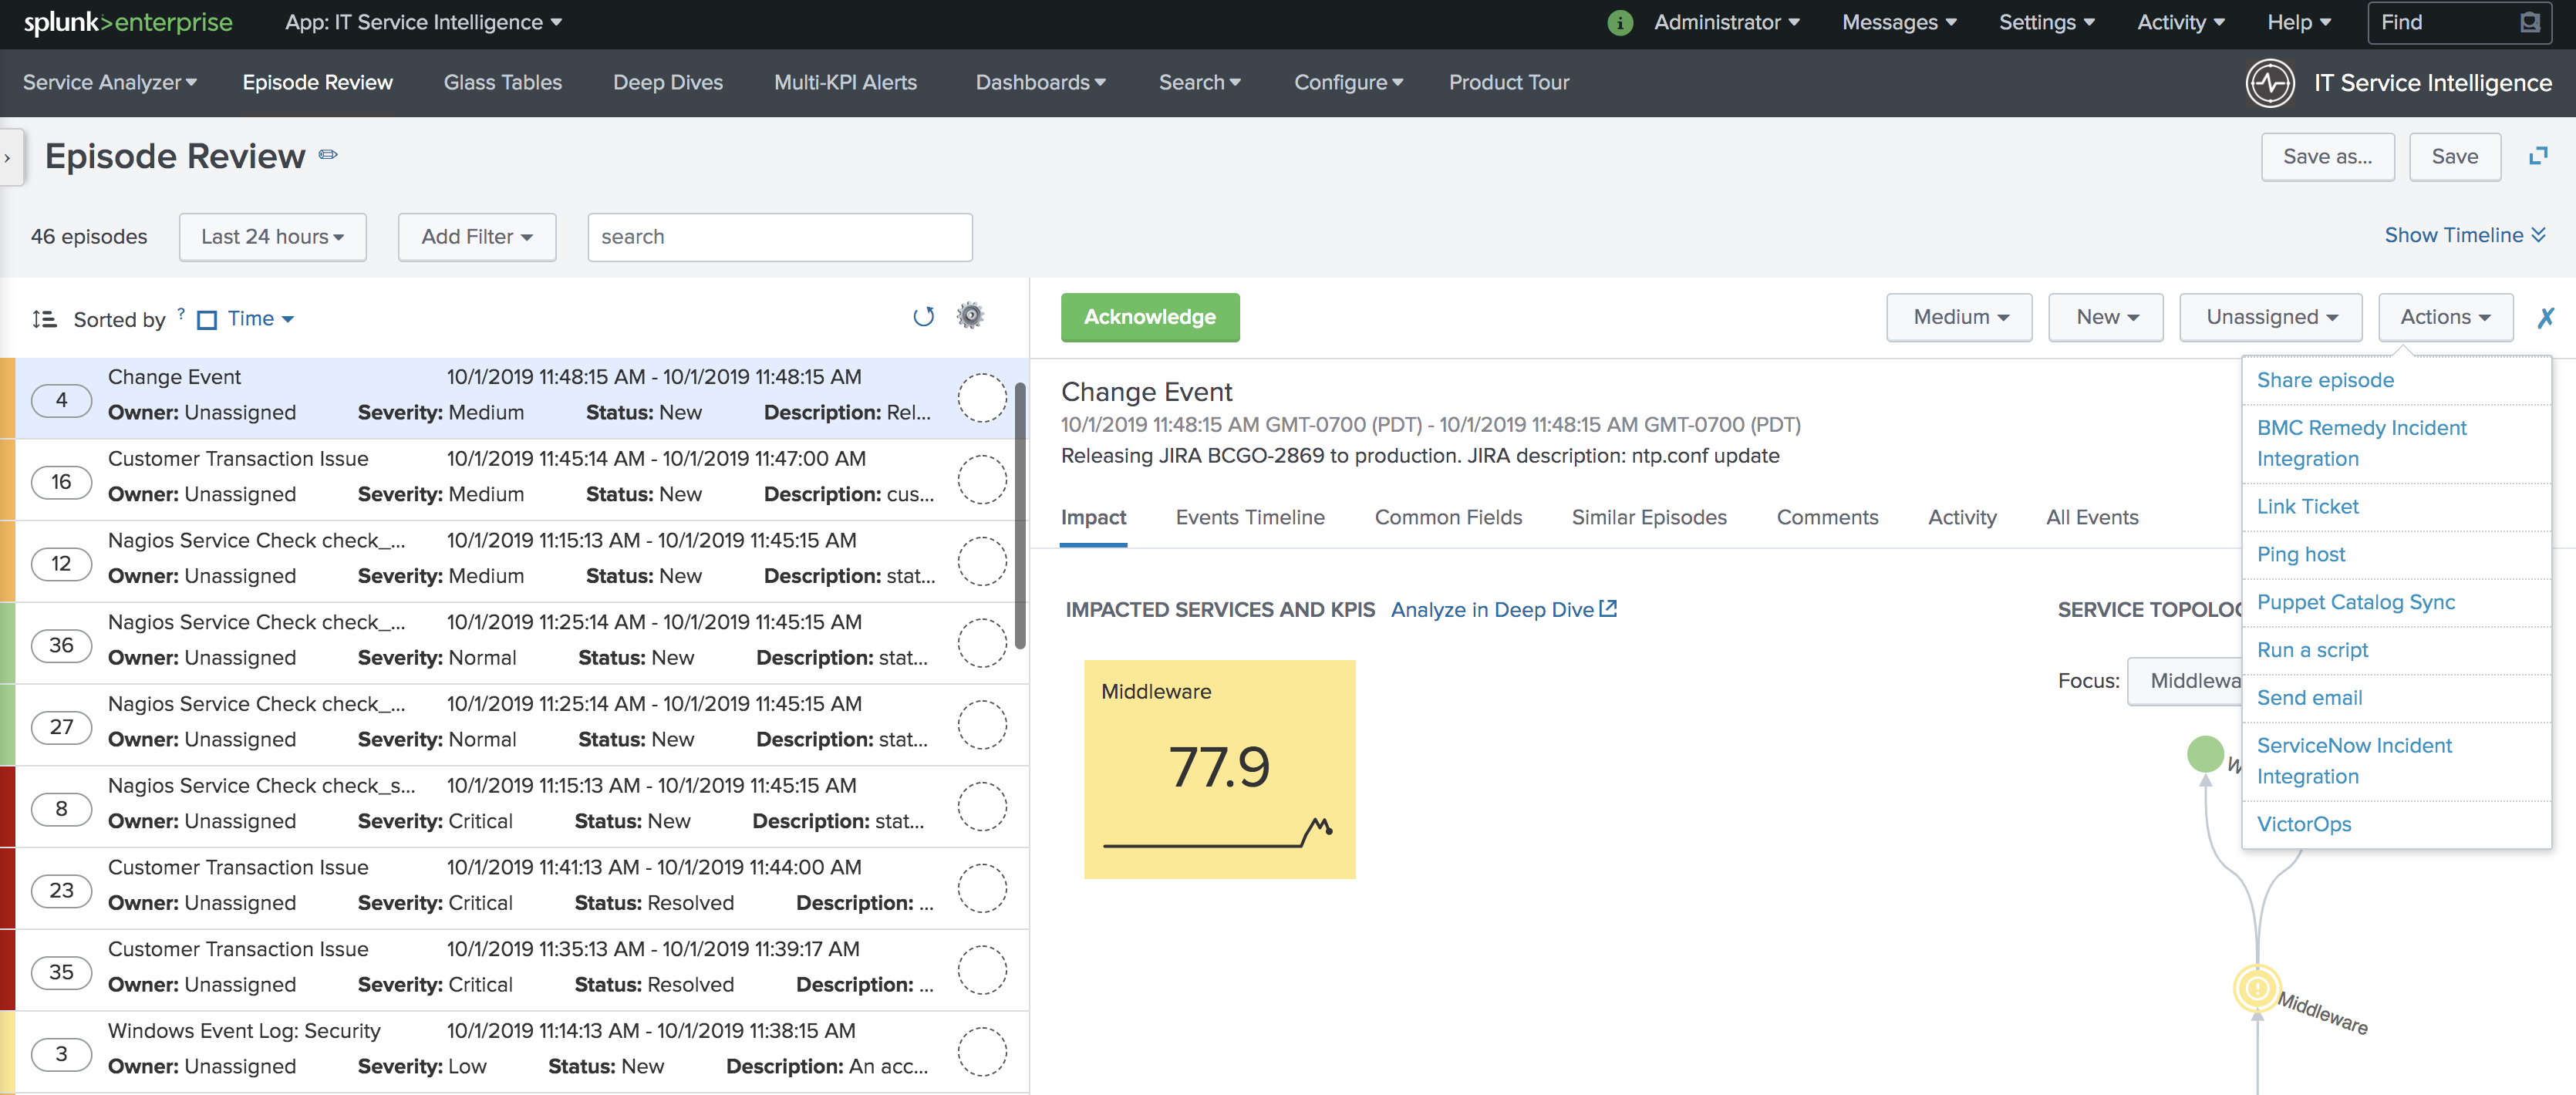
Configure the action making sure to select ACKNOWLEDGEMENT as the message type and ITSI as the monitoring tool, other values will be default values. The Alert Entity ID should be same as the initial alert so that VictorOps acknowledges the corresponding incident if default values are used.
Splunk SAI
About Splunk SAI and VictorOps
Splunk SAI allows you to search through depths of log data and monitor the health of your infrastructure and applications. The VictorOps and Splunk Insights for Infrastructure integration allows you to set alerting thresholds on key monitoring metrics and get alerts to the right person at the right time. Through a simple dropdown in the Splunk SAI platform, choose to send alerts directly into VictorOps where your team can collaborate and resolve incidents faster.
Make on-call suck less with the VictorOps and Splunk for Infrastructure integration. Easily provide contextual alerts to the appropriate on-call teammate and improve collaboration through automated escalations and alert routing in-line with your communication tools. Splunk Insights for Infrastructure and the Splunk App for Infrastructure provide deep system monitoring to help you understand your system’s health. Then, if an incident occurs, VictorOps steps in to help you collaborate and resolve the incident quickly.
See how the VictorOps and Splunk for Infrastructure integration helps add transparency to your applications and infrastructure, allowing you to build robust systems faster.
Data and Log Analytics Integrated with On-Call Incident Response
- In Splunk SAI alert actions menu, easily select VictorOps as a notification method–no webhooks or endpoints required
- Actively manage alert rules and routing, on-call schedules, and escalation policies in VictorOps to make the most of Splunk SAI monitoring data
- Surface alert context immediately for on-call responders in-line with additional remediation tools such as runbooks or live call routing
- Centralize communication with alerts and Splunk monitoring data, allowing you to remediate incidents quickly and help you conduct thorough post-incident reviews
- Build a transparent platform for end to end system monitoring and alerting, throughout the entire software delivery and incident lifecycle
This documentation will integrate Splunk SAI with your VictorOps account.
In VictorOps (SAI)
From the VictorOps web portal, navigate to Integrations >> 3rd Party Integrations >> Splunk Enterprise then click Enable Integration. Copy the API key to the clipboard to use in later steps.
In Splunk SAI
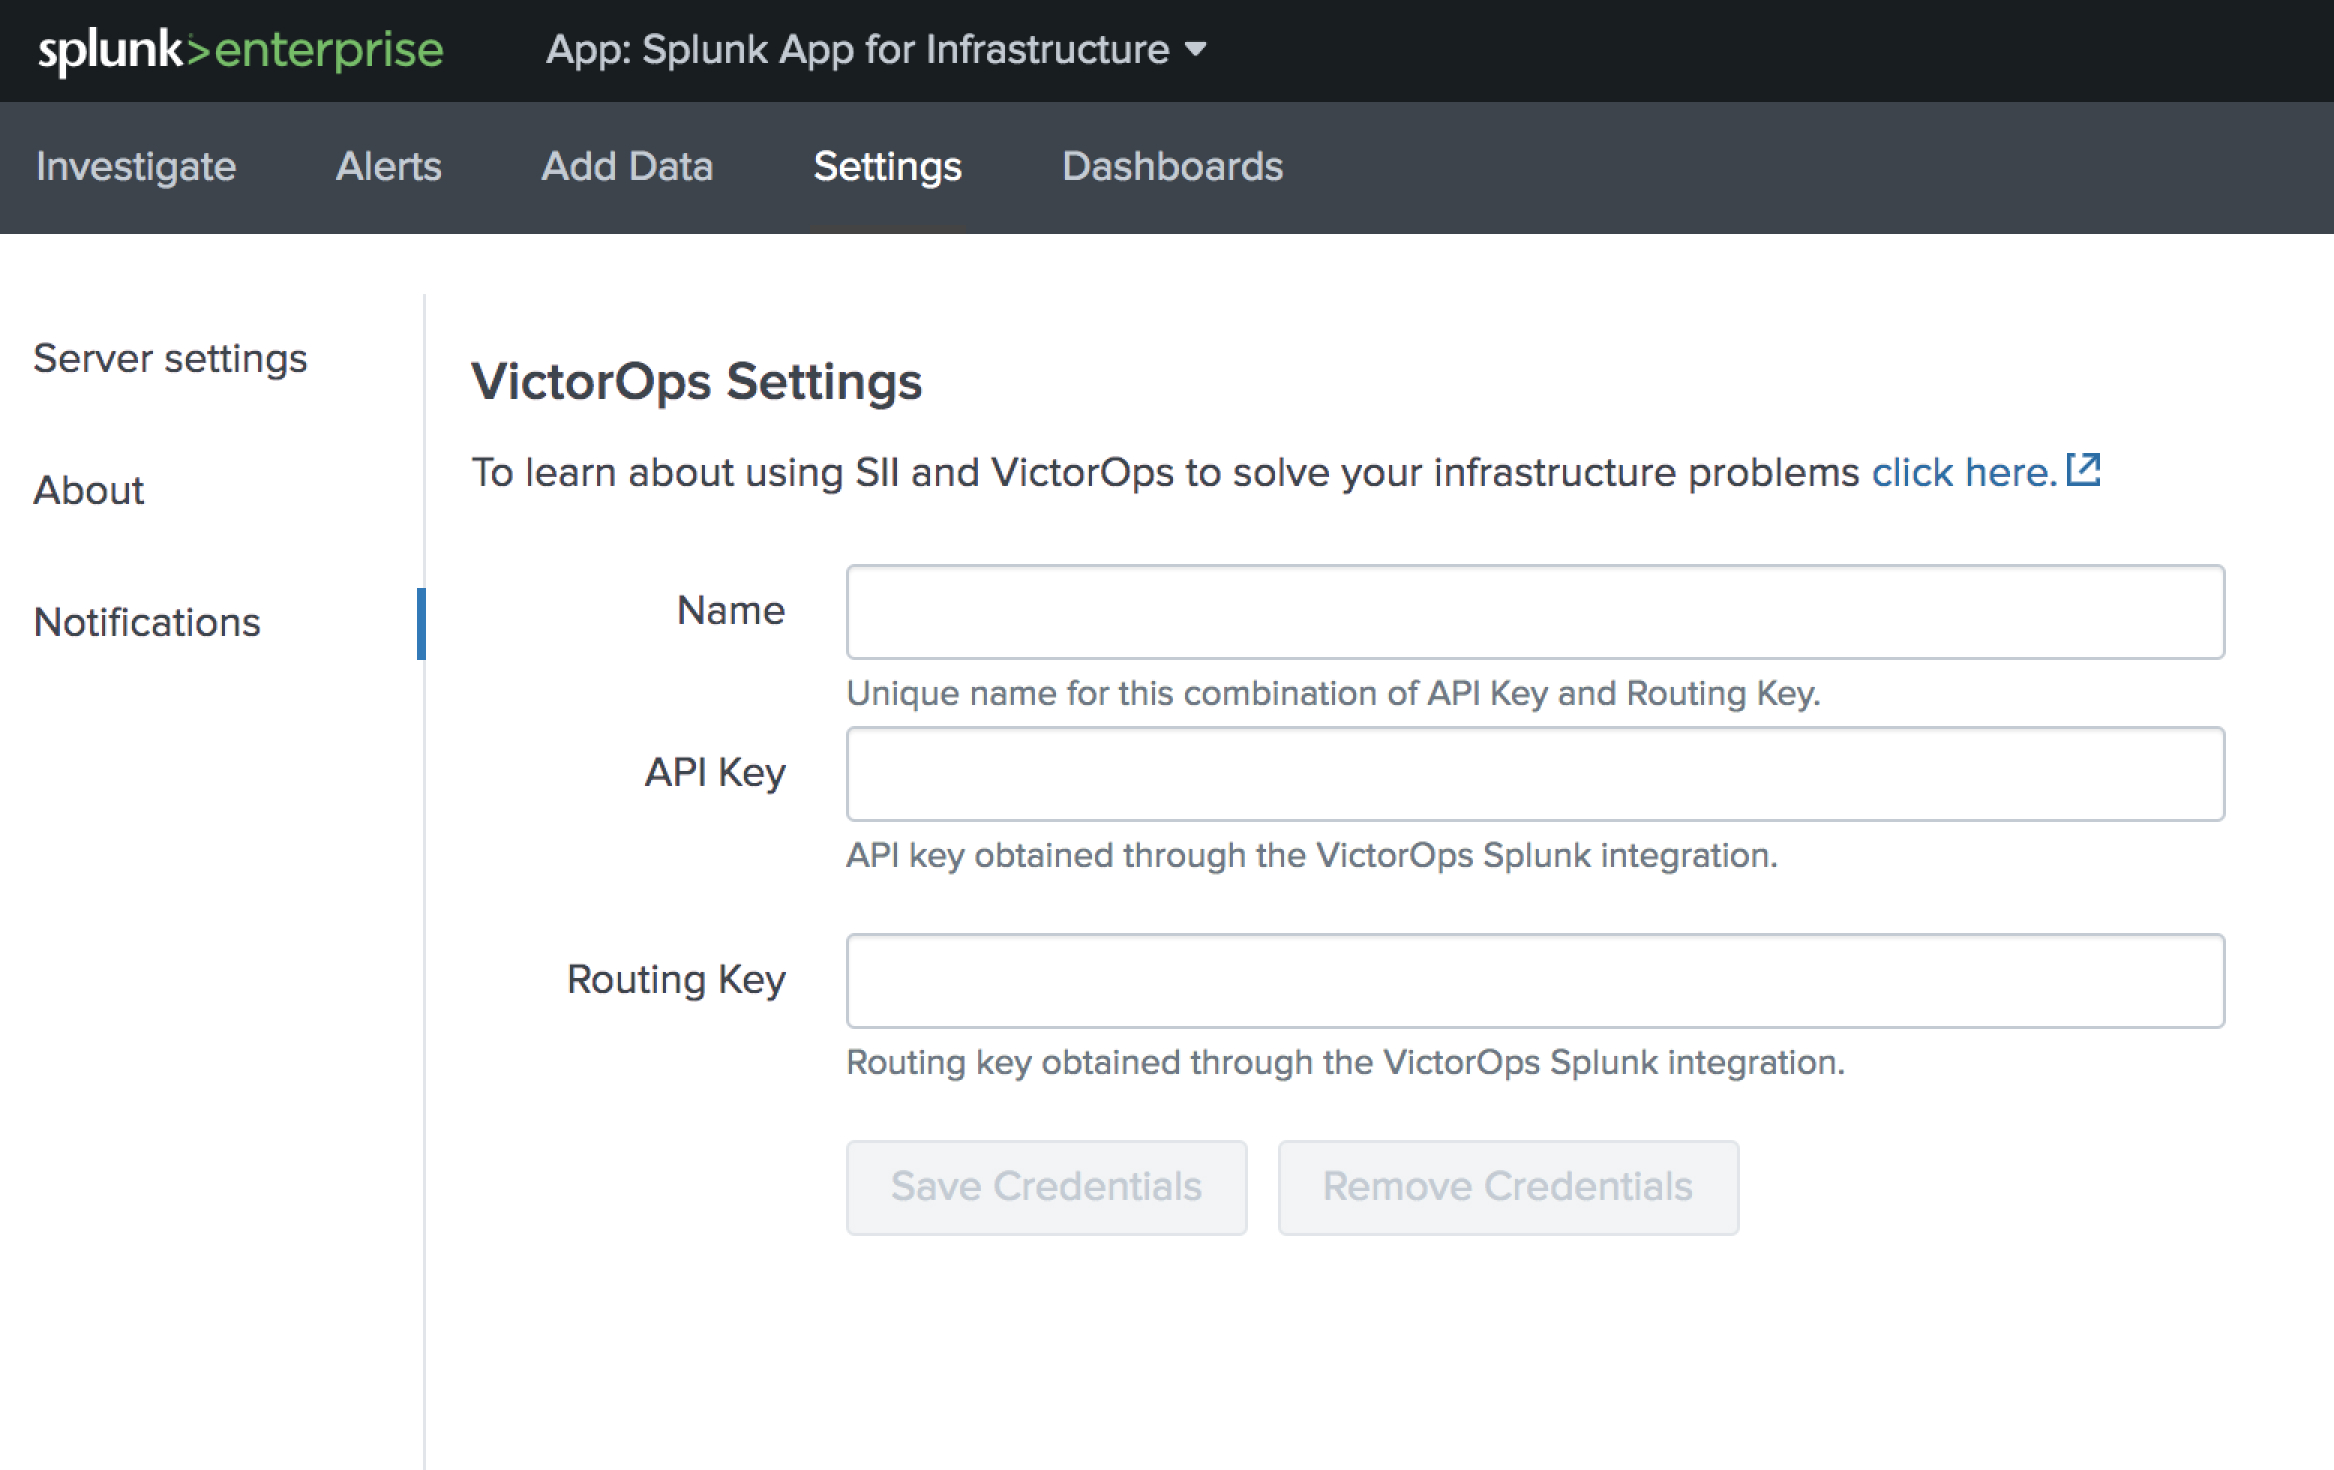
Navigate to Settings >> Notifications and paste your API key and and a routing key from your VictorOps account into the respective fields. Click Save Credentials.
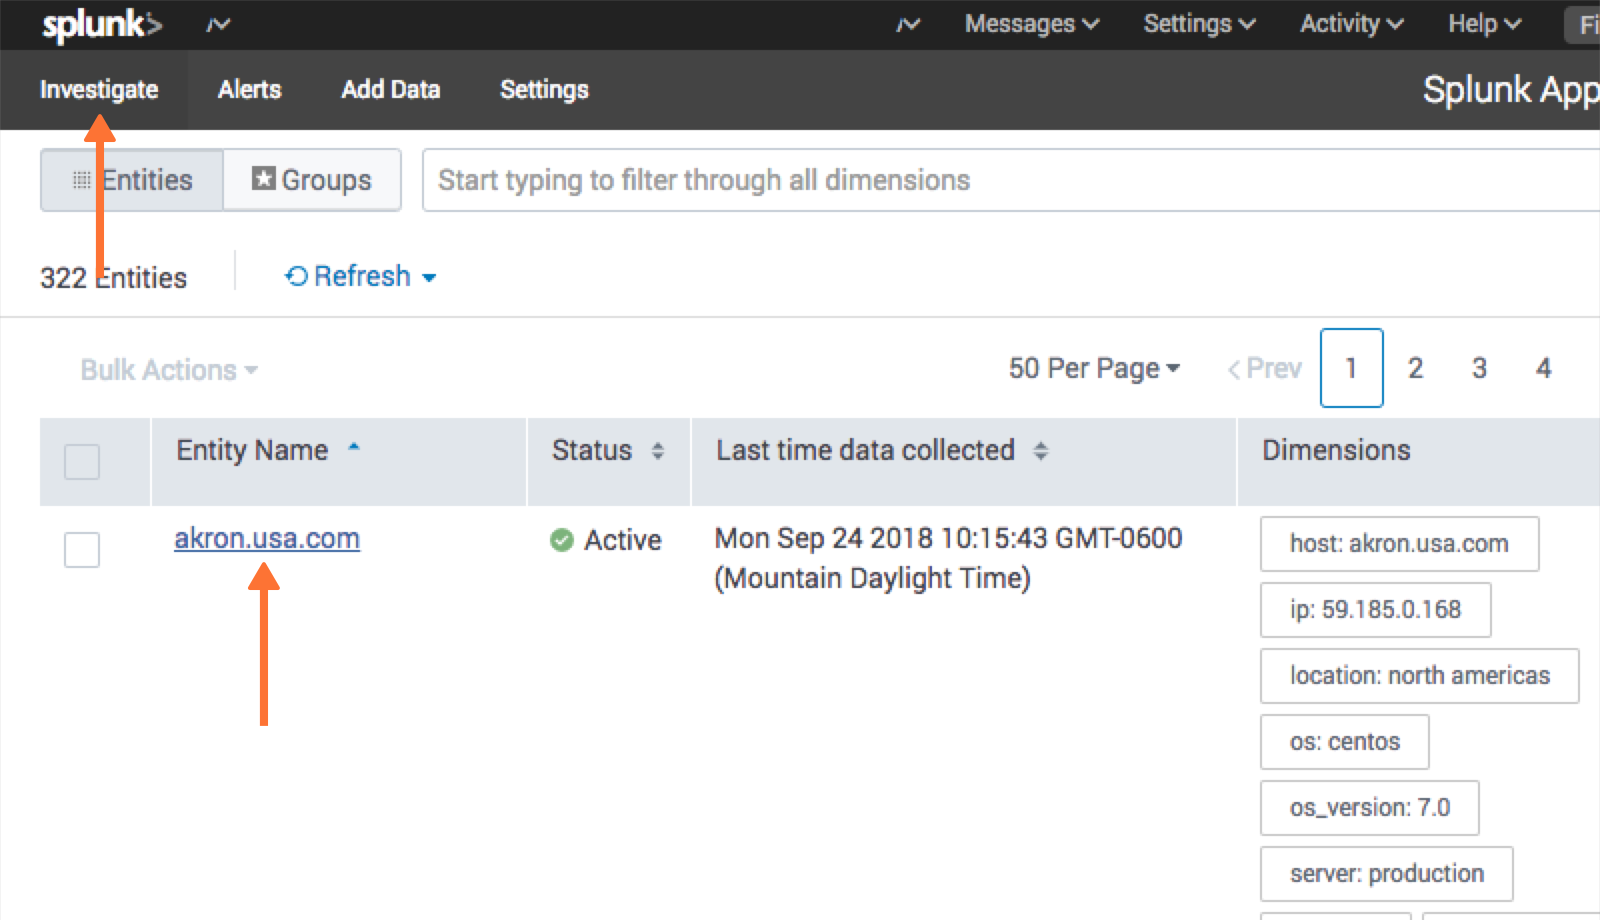
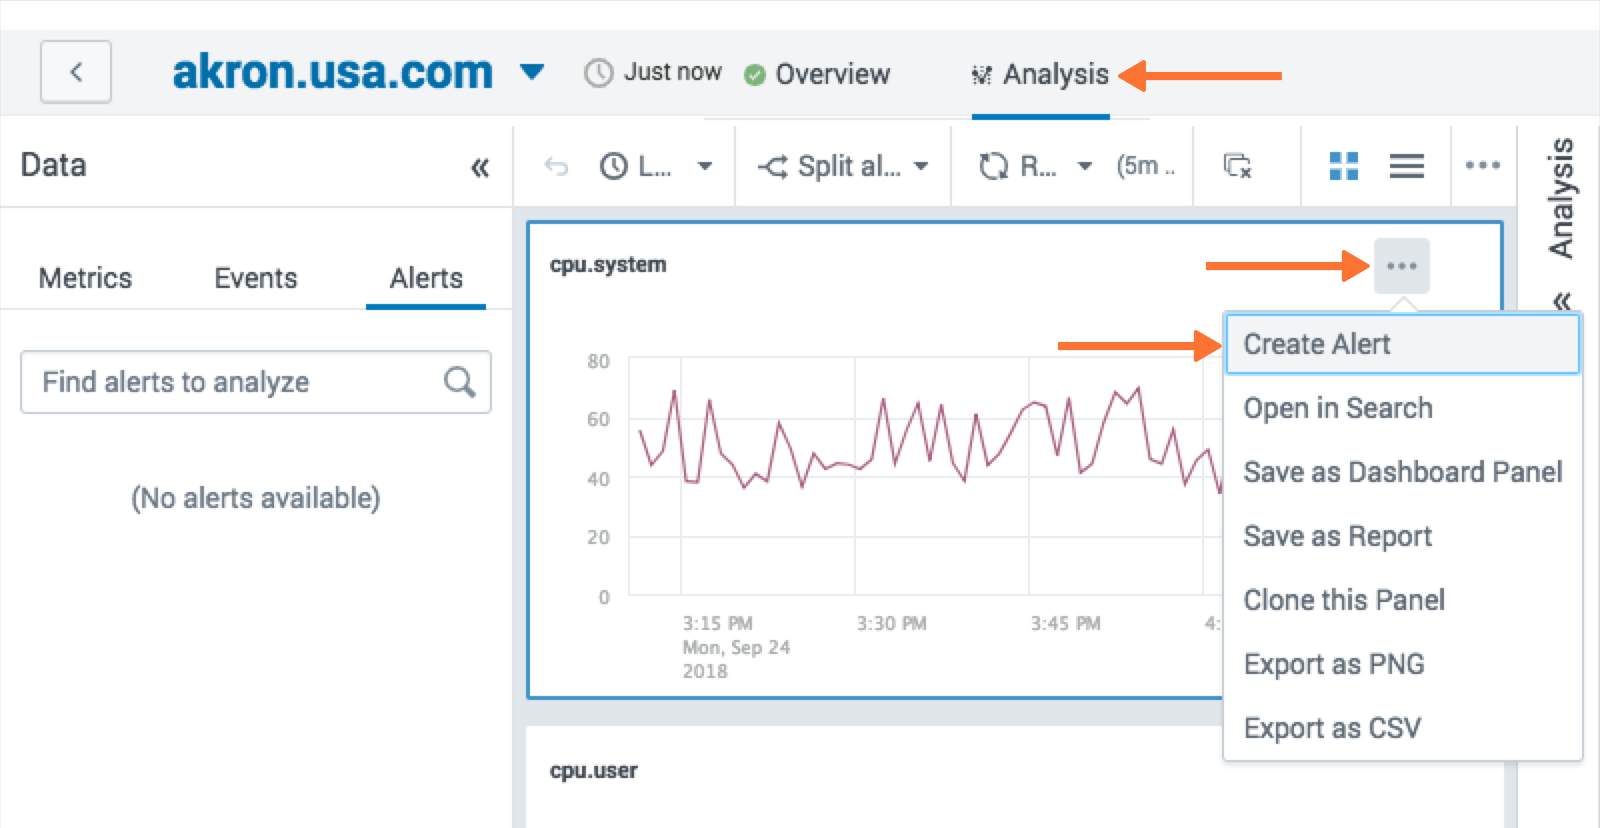
Now the VictorOps notification can be attached to alert. Under the Investigate page, select an entity.
Navigate to the Analysis tab and choose an alert graph, click the three dots and select Create Alert.
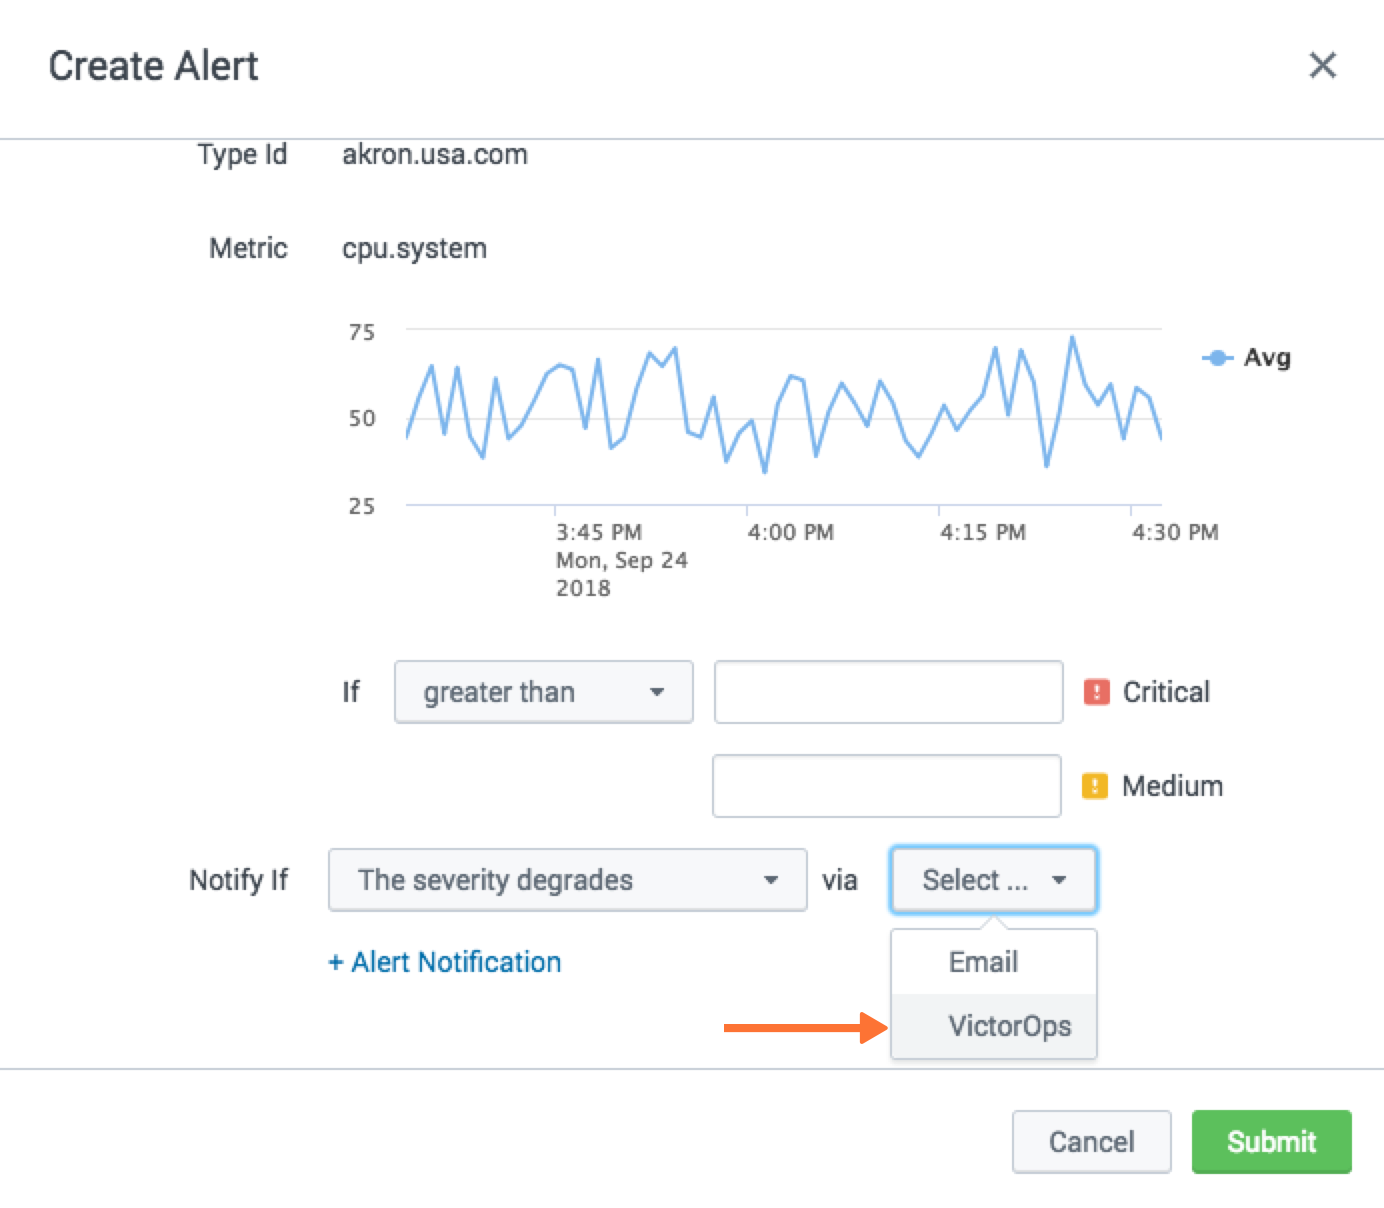
From the alert creation, scroll to the bottom of the modal and choose how under what conditions the alert should fire and then for the notification method select VictorOps. Click Submit.
Splunk Enterprise Security
About Splunk Enterprise Security
Splunk Enterprise Security (ES) enables security teams to use all data to gain organization-wide visibility and security intelligence. Regardless of deployment model—on-premises, in a public or private cloud, SaaS, or any combination of these—Splunk ES can be used for continuous monitoring, incident response, running a security operations center or for providing executives a window into business risk.
Splunk ES provides organizations the ability to:
- Improve security operations with faster response times
- Improve security posture by getting end-to-end visibility across all machine data
- Increase detection and investigation capabilities using advanced analytics
- Make better informed decisions by leveraging threat intelligence
In Splunk Enterprise Security App
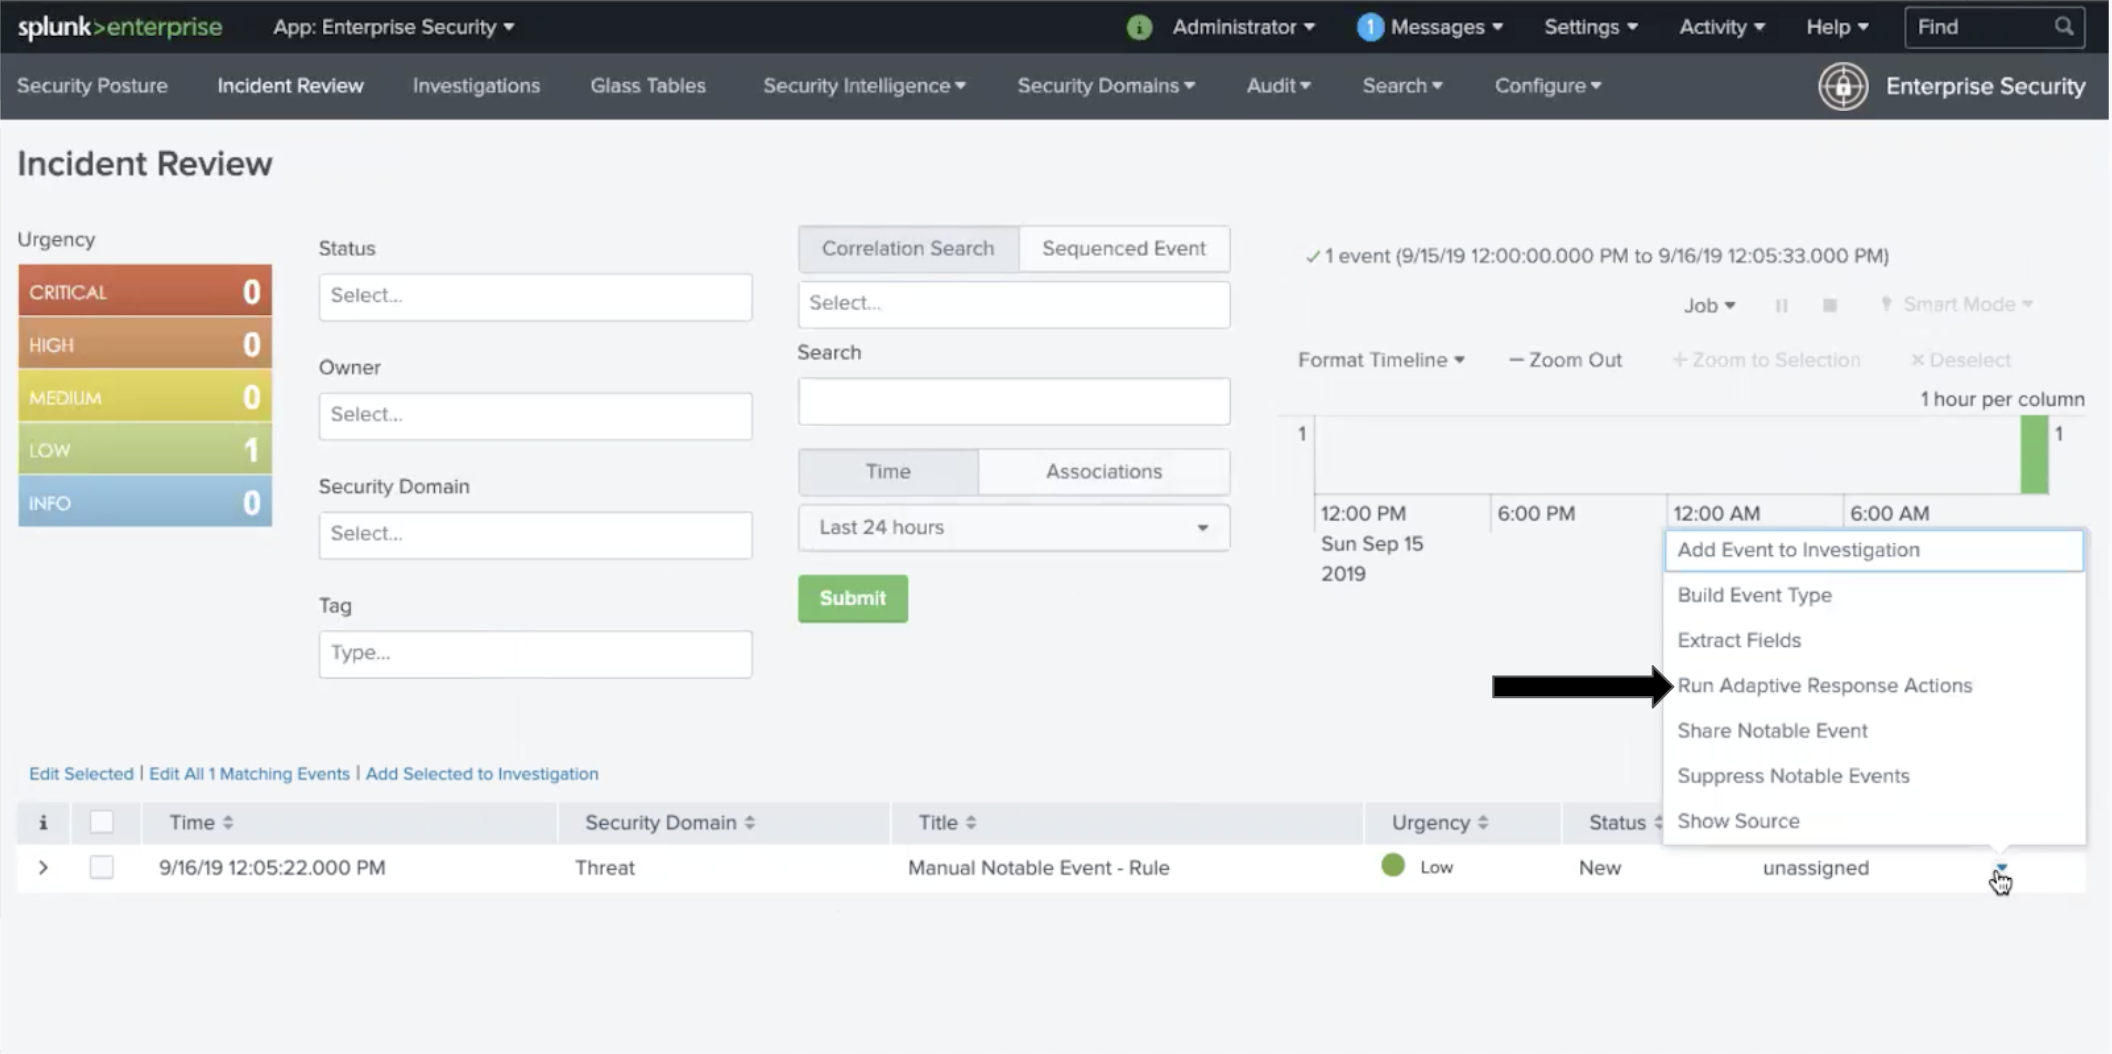
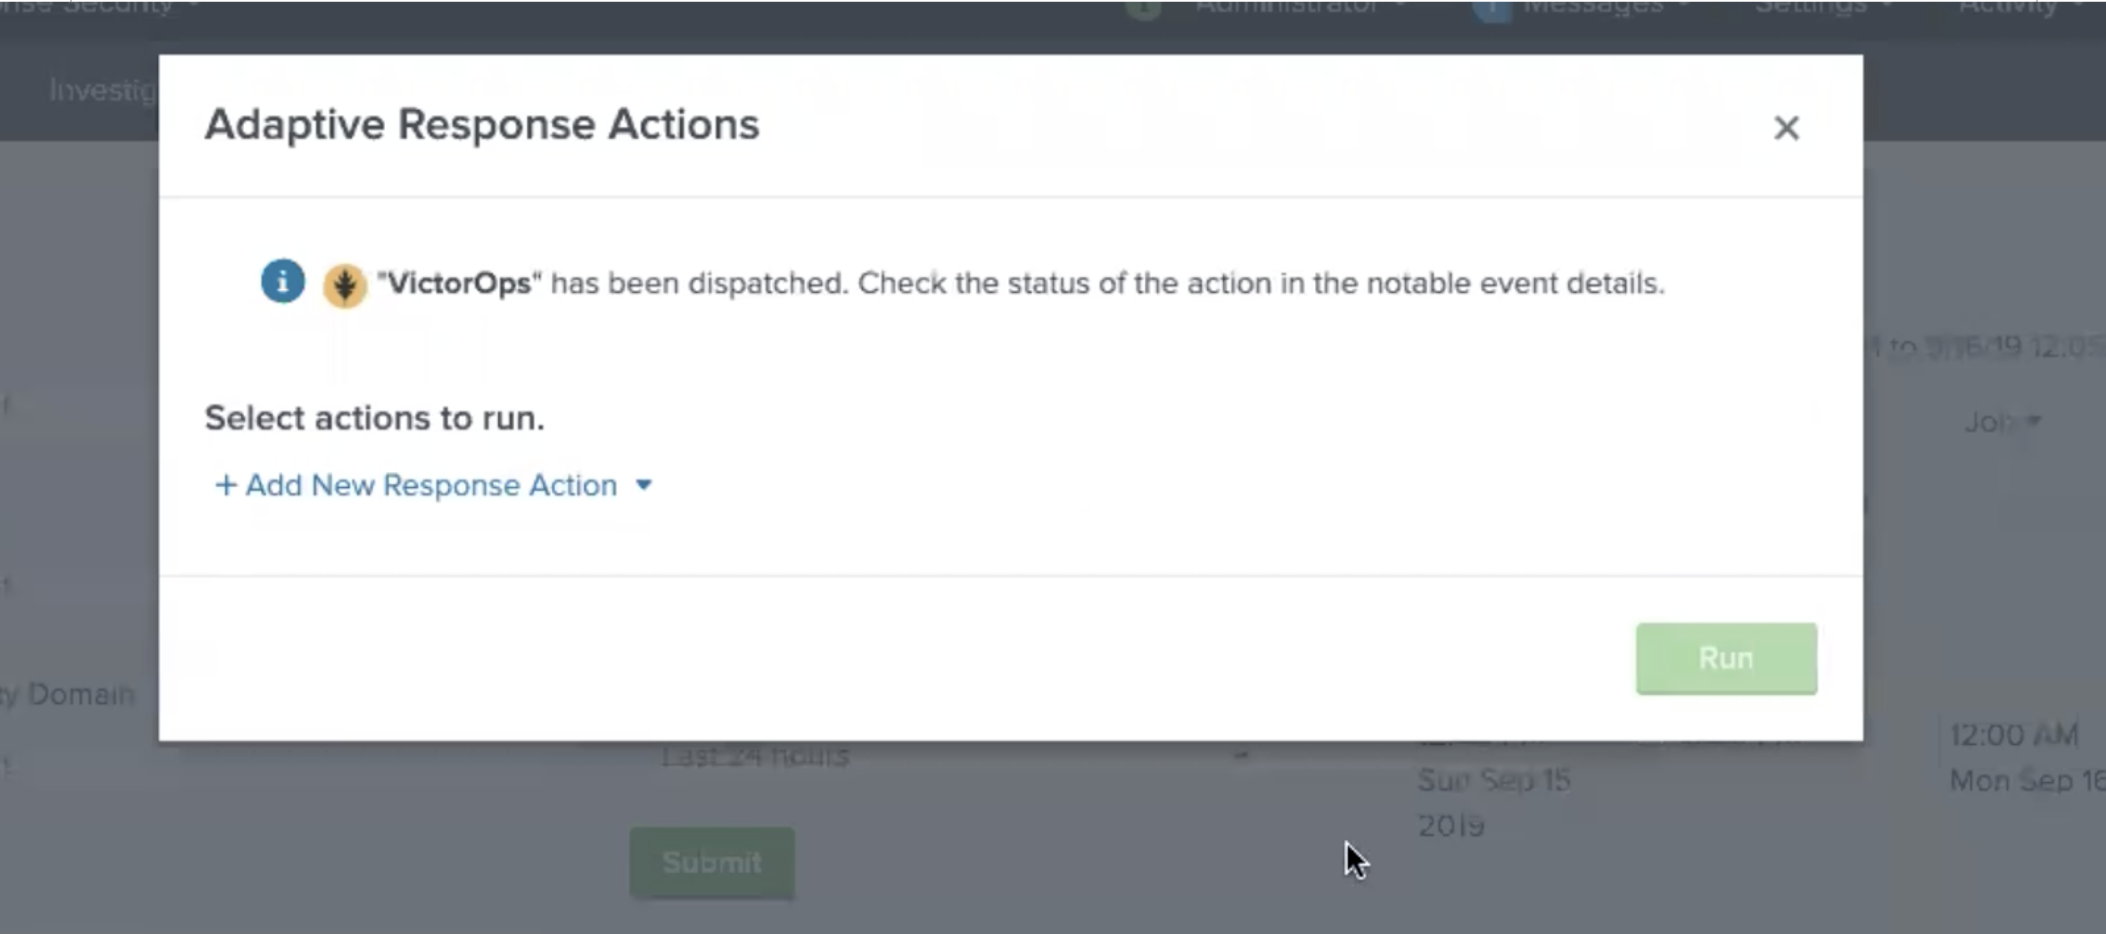
In the Splunk Enterprise Security App navigate to the Incident Review. Once in Incident Review, choose and incident you would like send to VictorOps and click the dropdown under Actions. Next, select the Run Adaptive Response Action.
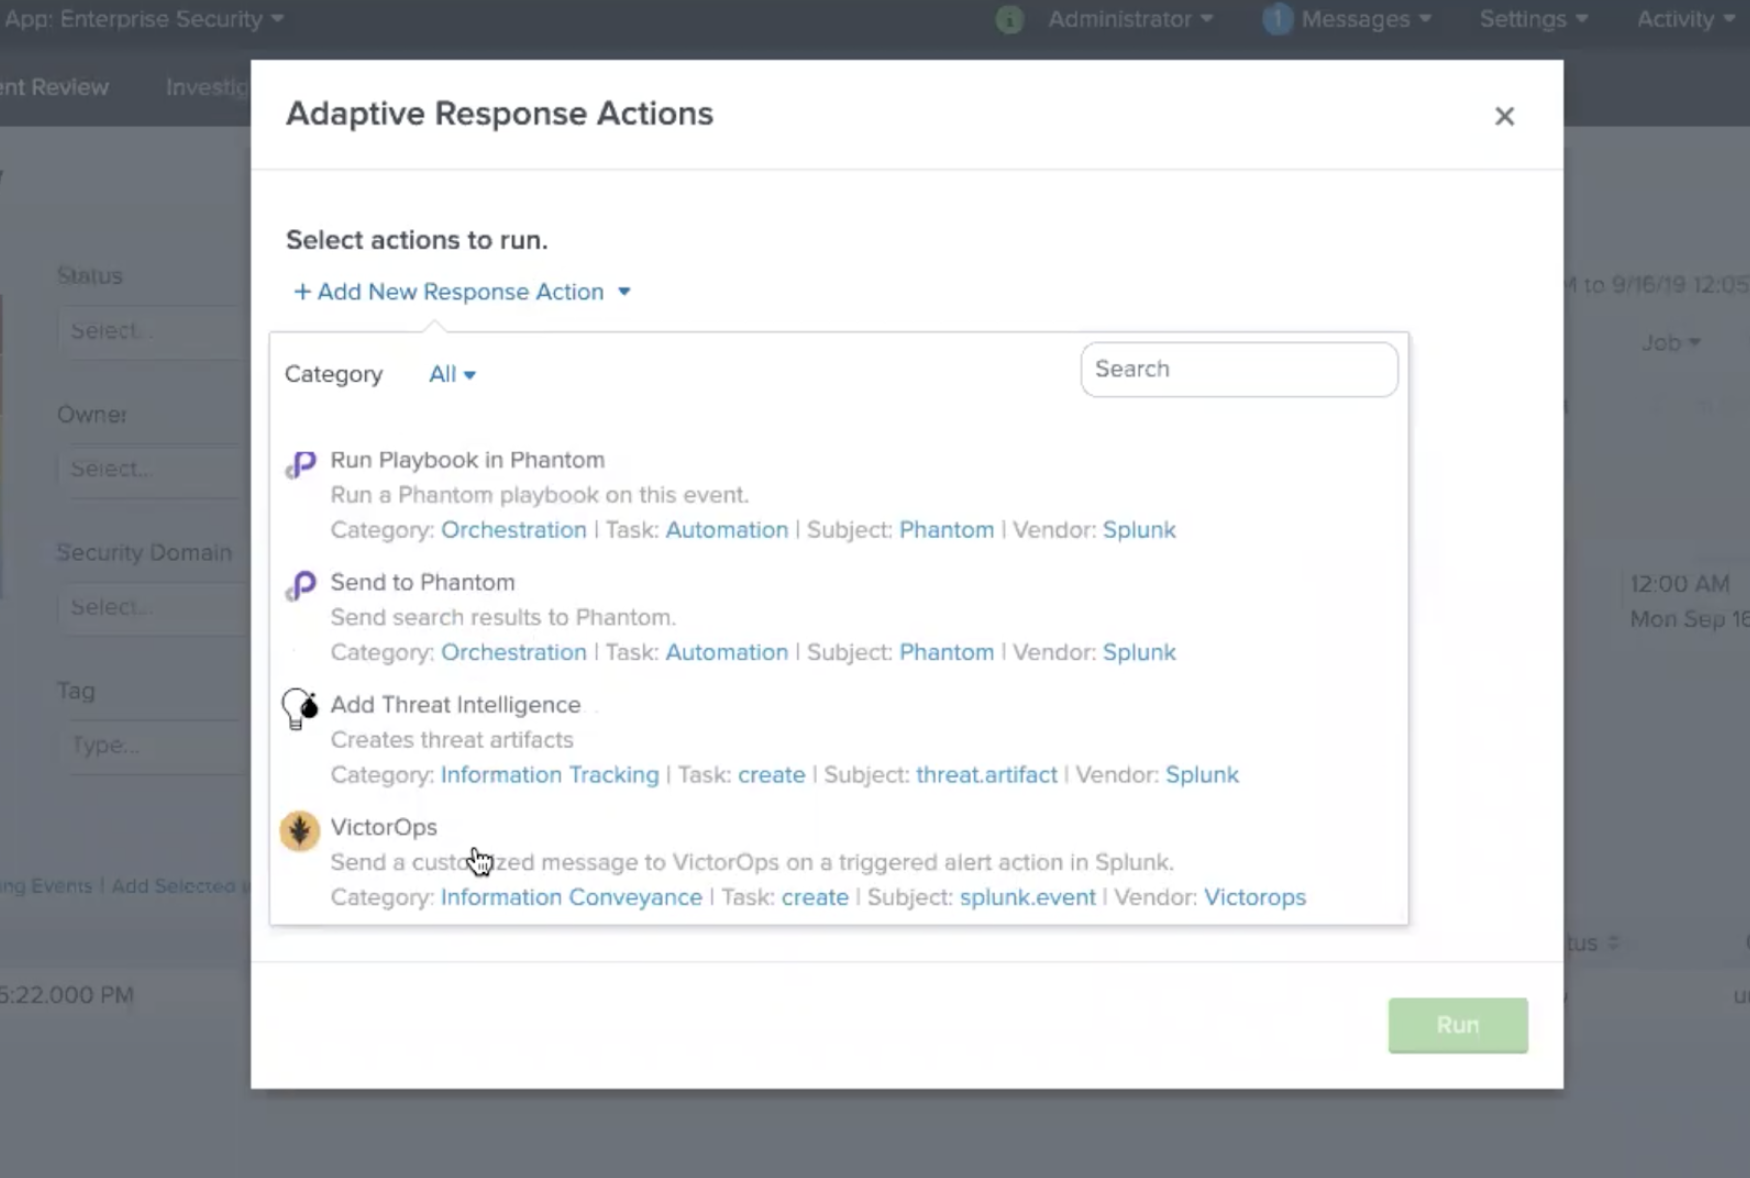
From here a pop up will appear allowing you to add VictorOps as a Response Action.
Once the Response Action has been dispatched you will receive a confirmation.
Troubleshooting
If you are having any troubles with the VictorOps Incident Management App in Splunk please read through the following troubleshooting steps for help. If your problem still persists, please send a detailed summary of your issue, when it first occurred, what version Splunk instance and VictorOps app you are currently running, and support will be able to help!
Issue: The VictorOps app was installed but I am not able to configure the app.
Splunk’s permissions are highly customizable. Please make sure you have the necessary permissions to configure and set up alerts for VictorOps. You can find the necessary permissions under “General Requirements” at the top of this knowledge base.
Issue: The VictorOps Alert Action is visible but there is no option to customize the Alert Actions.
This is oftentimes because the VictorOps App Alert Action permissions are not set to global. Go to Settings >>> Alert Actions and make sure VictorOps App is set to Global sharing.
Issue: The VictorOps App has been successfully configured and test alerts are making it to VictorOps but the VictorOps Alert Action is not visible.
Sometimes a simple “reset” of the Alert Action permission will do the trick. Go to Settings >>> Alert Action >>> VictorOps (Permissions). Next to “Display For” check “app”, save, then reopen permission and select “All apps”. Now, check your alert trigger action on an alert to see if the VictorOps Alert Action is now visible.
Issue: Integration is set up correctly, with all the correct permissions but the test alert and routing key retrieval is failing. This can sometimes be caused by a firewall or multiple firewalls. To check to see if it is an internal network issue you can run the cURL command below:
curl -X POST "https://alert.victorops.com/integrations/generic/20131114/alert/SPLUNK_API_KEY --insecure -H "accept: application/json" -H "Content-Type: application/json" -d '{"message_type": "INFO", "monitoring_tool": "splunk", "state_message": "Test Alert", "entity_display_name": "Test Alert"}'`
If the post does not make it to VictorOps please grep for sendalert in the $SPLUNK_HOME/var/log/splunk/victorops_modalert.log and send the output to victorops-support@splunk.com and a detailed summary of the issue you are facing.
Issue: The VictorOps App is installed, the Alert Action is visible in Alert Actions Settings, but the VictorOps app is not visible as an alert action for an alert.
Please run ./splunk btool check –debug and send victorops-support@splunk.com the log and a detailed summary of the issue you are facing.
Issue: Splunk (enterprise) alerts stopped alerting in VictorOps.
Please try to post the below cURL to check for any internal network issues. If the post makes it to VictorOps please check your firewalls.
curl -X POST "https://alert.victorops.com/integrations/generic/20131114/alert/SPLUNK_API_KEY --insecure -H "accept: application/json" -H "Content-Type: application/json" -d '{"message_type": "INFO", "monitoring_tool": "splunk", "state_message": "Test Alert from localhost", "entity_display_name": "Test Alert"}'`
If the post does not make it to VictorOps please grep for sendalert in the $SPLUNK_HOME/var/log/splunk/victorops_modalert.log and send the output to victorops-support@splunk.com and a detailed summary of the issue you are facing.
Issue: Integrating with ITSI Version < 4.0
Part of the integration relies on system macros not included with older versions of ITSI. To alleviate the issue, you can create the macros by navigating to Settings>>Advanced Settings>>Search Macros within Splunk. Ensure the following macros exist:
| Macro | Definition |
| itsi_notable_event_actions_temp_state_values | eval action_temp_status=status | eval action_temp_owner=owner | eval action_temp_severity=severity | eval action_temp_title=title | eval action_temp_description=description |
| itsi_notable_event_actions_coalesce_state_values | eval status=coalesce(status, action_temp_status) | eval owner=coalesce(owner, action_temp_owner) | eval severity=coalesce(severity,action_temp_severity) | eval title=coalesce(title, action_temp_title) | eval description=coalesce(description, action_temp_description) | fields – action_temp_* |
| itsi_notable_group_lookup | lookup itsi_notable_group_user_lookup _key AS itsi_group_id OUTPUT owner severity status instruction | lookup itsi_notable_group_system_lookup _key AS itsi_group_id OUTPUT title description start_time last_time is_active event_count |