Versions Supported: N/A (SaaS)
VictorOps Version Required: Starter, Growth, or Enterprise
Dotcom is a powerful SaaS based Load Testing and Monitoring Suite, used by thousands of customers around the world. Businesses have realized that reliable services are essential for succeeding in global markets. At dotcom monitor they help customers identify and eliminate performance hotspots pre-production and monitor their business applications 24 / 7 on production. For quick error resolution, they provide powerful alerting features such as the integration to Splunk On-Call. This helps to reduce MTTR and brings issues quickly at your fingertips.
This guideline provides a step by step description on how to enable the alerting integration between dotcom monitor and Splunk On-Call. The Splunk On-Call integration with dotcom monitor creates an Incident in the Splunk On-Call Timeline whenever a dotcom monitor alert is triggered. The following is a quick walkthrough on how to set up the integration.
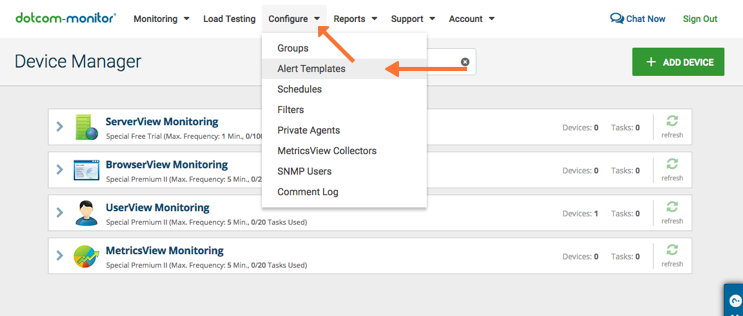
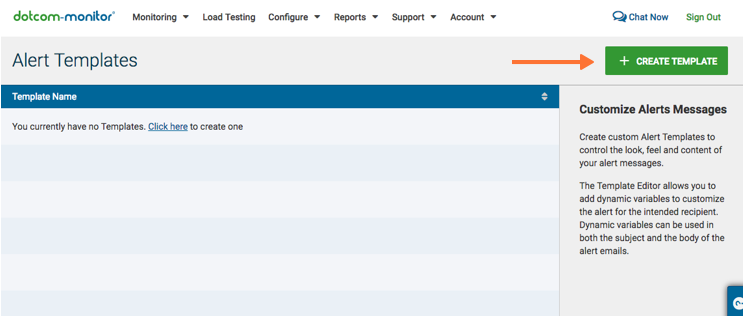
- Login to dotcom monitor portal. From the dotcom monitor UI select Configure ==> Alert Templates ==> + Create Template
- Delete the pre-populated content in the Alert Template (seen in the picture below) and instead enter the following information for the Error Source, Test Source and Uptime Source fields, within this New Template:
Name Name entered here Email Subject N/A Email Reply-tp Email entered here Type Txt Error Source {“message_type”:”critical”,”monitoring_tool”:”Dotcom-Monitor”,”state_message”:”Error occurred during the device monitoring at <%Monitor_DateTime%> Monitoring location:<%Location%>”,”entity_id”:”<%Site_Name%>”} Test Source {“message_type”:”critical”,”monitoring_tool”:”Dotcom-Monitor”,”state_message”:”Test message”,”entity_id”:”Test message”} Uptime Source {“message_type”:”recovery”,”monitoring_tool”:”Dotcom-Monitor”,”state_message”:”Device <%Site_Name%> detected to be back online at <%Monitor_DateTime%> from monitoring location: <%Location%>”,”entity_id”:”<%Site_Name%>”} 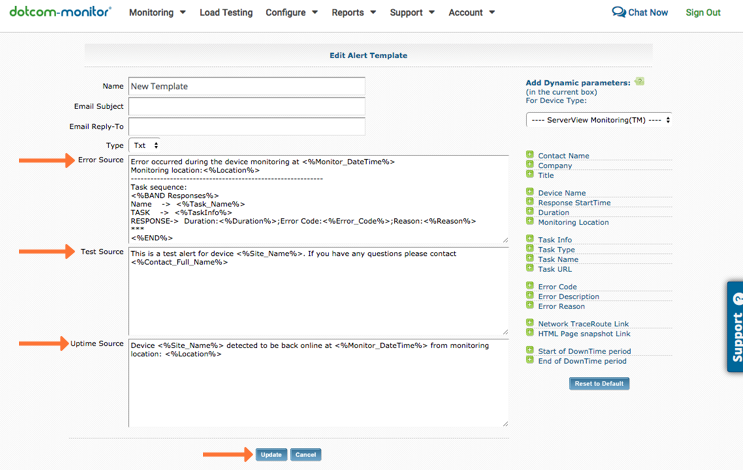
- Click on the Update button to save your Alert Template.
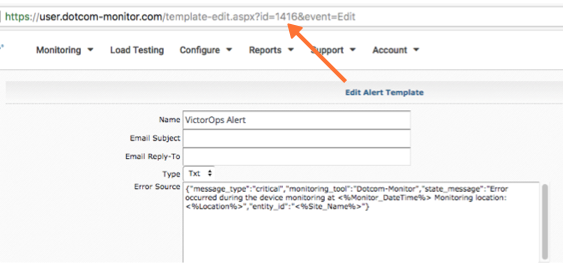
- Select Configure / Alert Templates from the menu and then select the newly created Splunk On-Call Alert. Get your Template ID from the URL field (number between id= and & –> 1416 in this example). We will need the Template ID in Step 8.
- In Splunk On-Call, as an Admin user, select Integrations >> Dotcom-Monitor
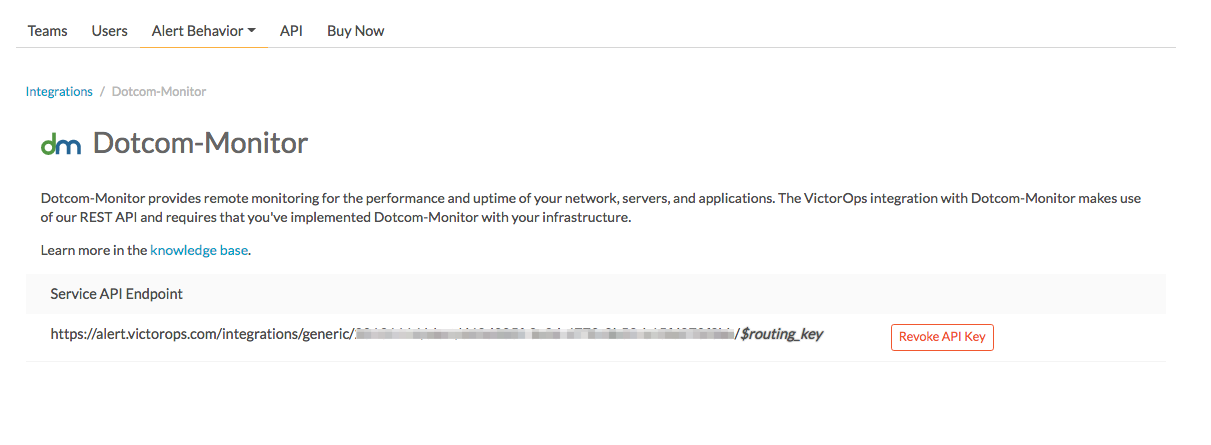
- If the integration has not yet been enabled, click the “Enable Integration” button to generate your endpoint URL as seen below. Be sure to replace the “$routing_key” section with the actual routing key you intend to use. (To view or configure route keys in Splunk On-Call, click Alert Behavior >> Route Keys)
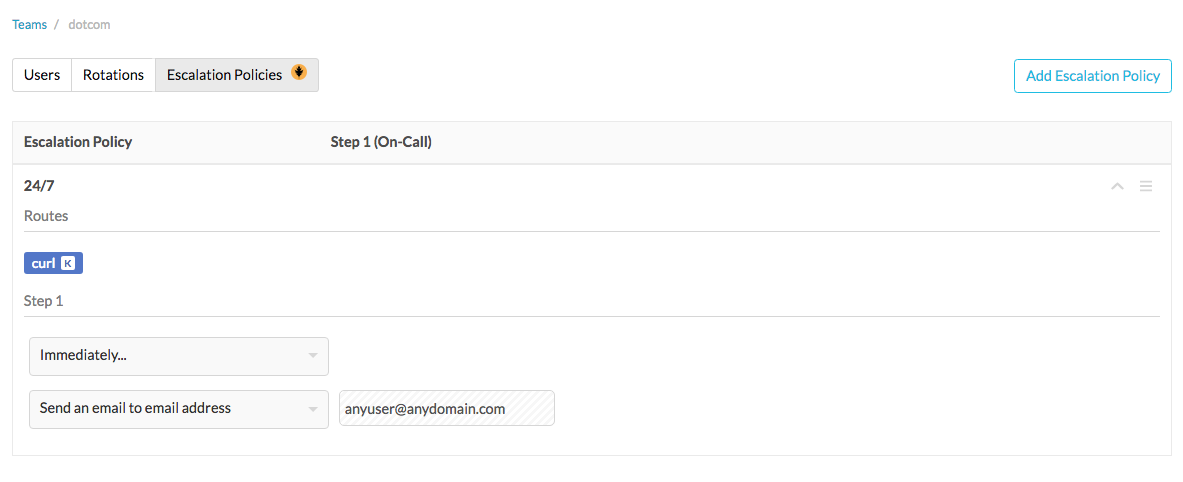
- Create or edit a Team and add the Users who should receive alerts. Add an escalation policy and please note that routing keys will appear after you’ve completed the routing key configuration.
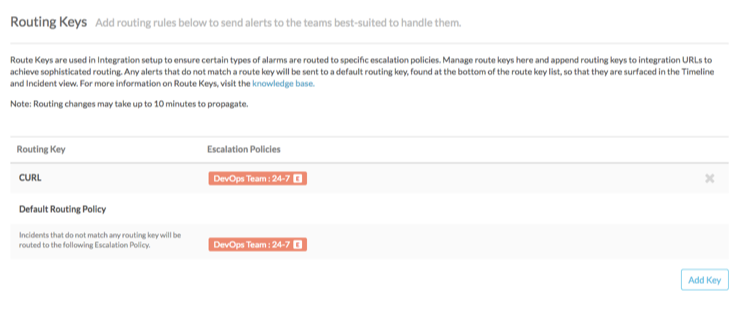
- Add a routing key using the “Add Key”, named curl. Then add the escalation policy (your team which should receive the alert). Set the Default Routing Policy (your team which should receive not mapped alerts).
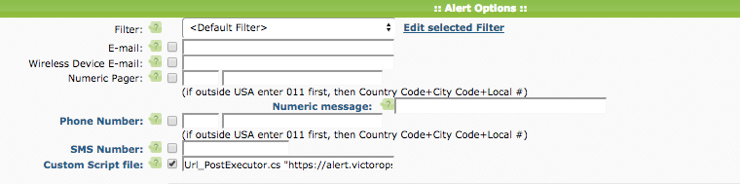
- Going back into dotcom monitor and Edit your device. Navigate to the Alert Options section and select the custom Script file checkbox. Add the following value into the Custom Script text box:
Url_PostExecutor.cs “Service API Endpoint/Routing Key” “Template ID”
Get your Service API Endpoint from Splunk On-Call Portal as shown in step 5
Get your routing key from Splunk On-Call Portal as shown in step 7
Get your Template ID from Dotcom monitor portal as shown in step 4
Sample Custom Script file we’ve used in this showcase:
Url_PostExecutor.cs “https://alert.victorops.com/integrations/generic/20131114/alert/aa57b71c-8374-48ef-a649-fe15ed19a88ff/CURL” “1416”
- Click on the button Update to save this configuration.
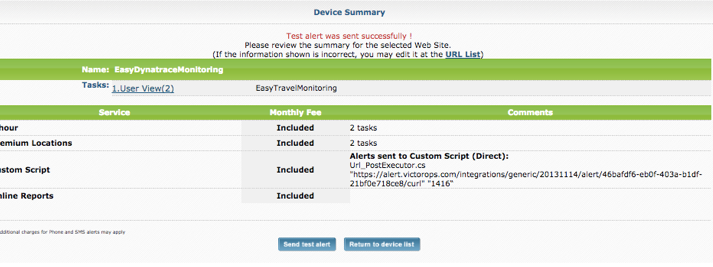
- Click on the Send test alert. The screenshot below shows how to initiate the send of your test alert.
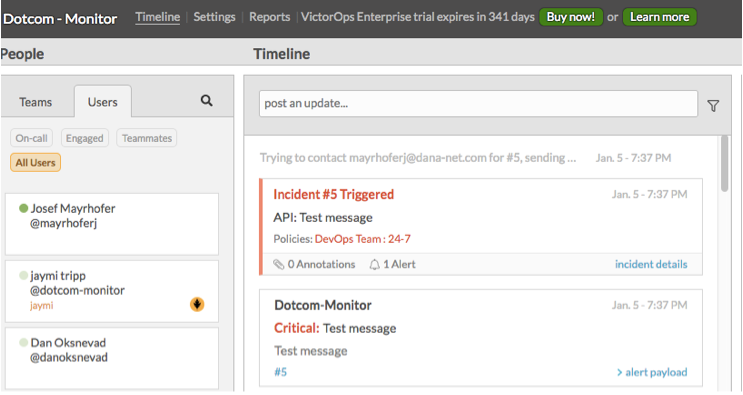
- Go back into your Splunk On-Call account and make sure that you are viewing the Timeline. Check if the alert has been received. Below is a screenshot showing that the alert has been received.
 Congratulations! You’ve successfully sent your first alert from Dotcom monitor to Splunk On-Call!