Versions Supported: N/A (SaaS)
VictorOps Version Required: Getting Started or Essentials; Full-Stack for added features
What you need to know: To ensure incidents are resolved correctly, choose static fields for the Critical and Resolved subject lines.
LogicMonitor replaces multiple monitoring solutions – it monitors everything in your datacenter: servers (physical, virtual, or cloud based), applications (web, mail, database, virtualization, etc), networking gear, storage arrays, load balancers, UPS, etc, using a single web portal. The VictorOps integration with LogicMonitor makes use of the REST API and requires that you have implemented LogicMonitor in your infrastructure.
In VictorOps
In VictorOps, select Settings > Alert Behavior > Integrations > LogicMonitor
If the integration has not yet been enabled, click the “Enable Integration” button to generate your endpoint URL as seen below. Be sure to replace the “$routing_key” section with the actual routing key you intend to use. (To view or configure route keys in VictorOps, click Alert Behavior > Route Keys)
In LogicMonitor
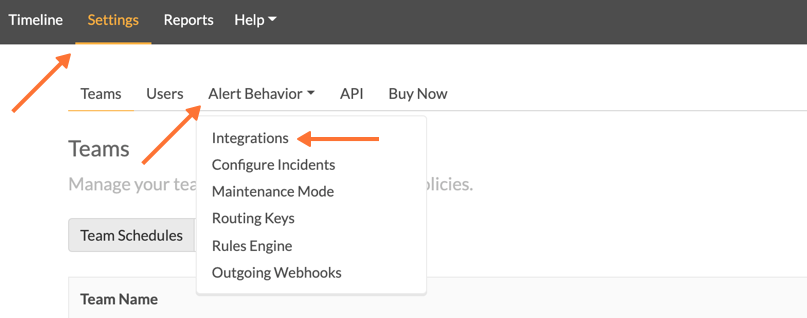
- From the main dashboard select Settings > Integrations and click the Add button.
- In the modal, select Custom HTTP Delivery
- Fill in the following values as shown below:
- Name: VictorOps
- Description: Send alert information to VictorOps
- Select Use different URLs or data formats to notify on various alert activity
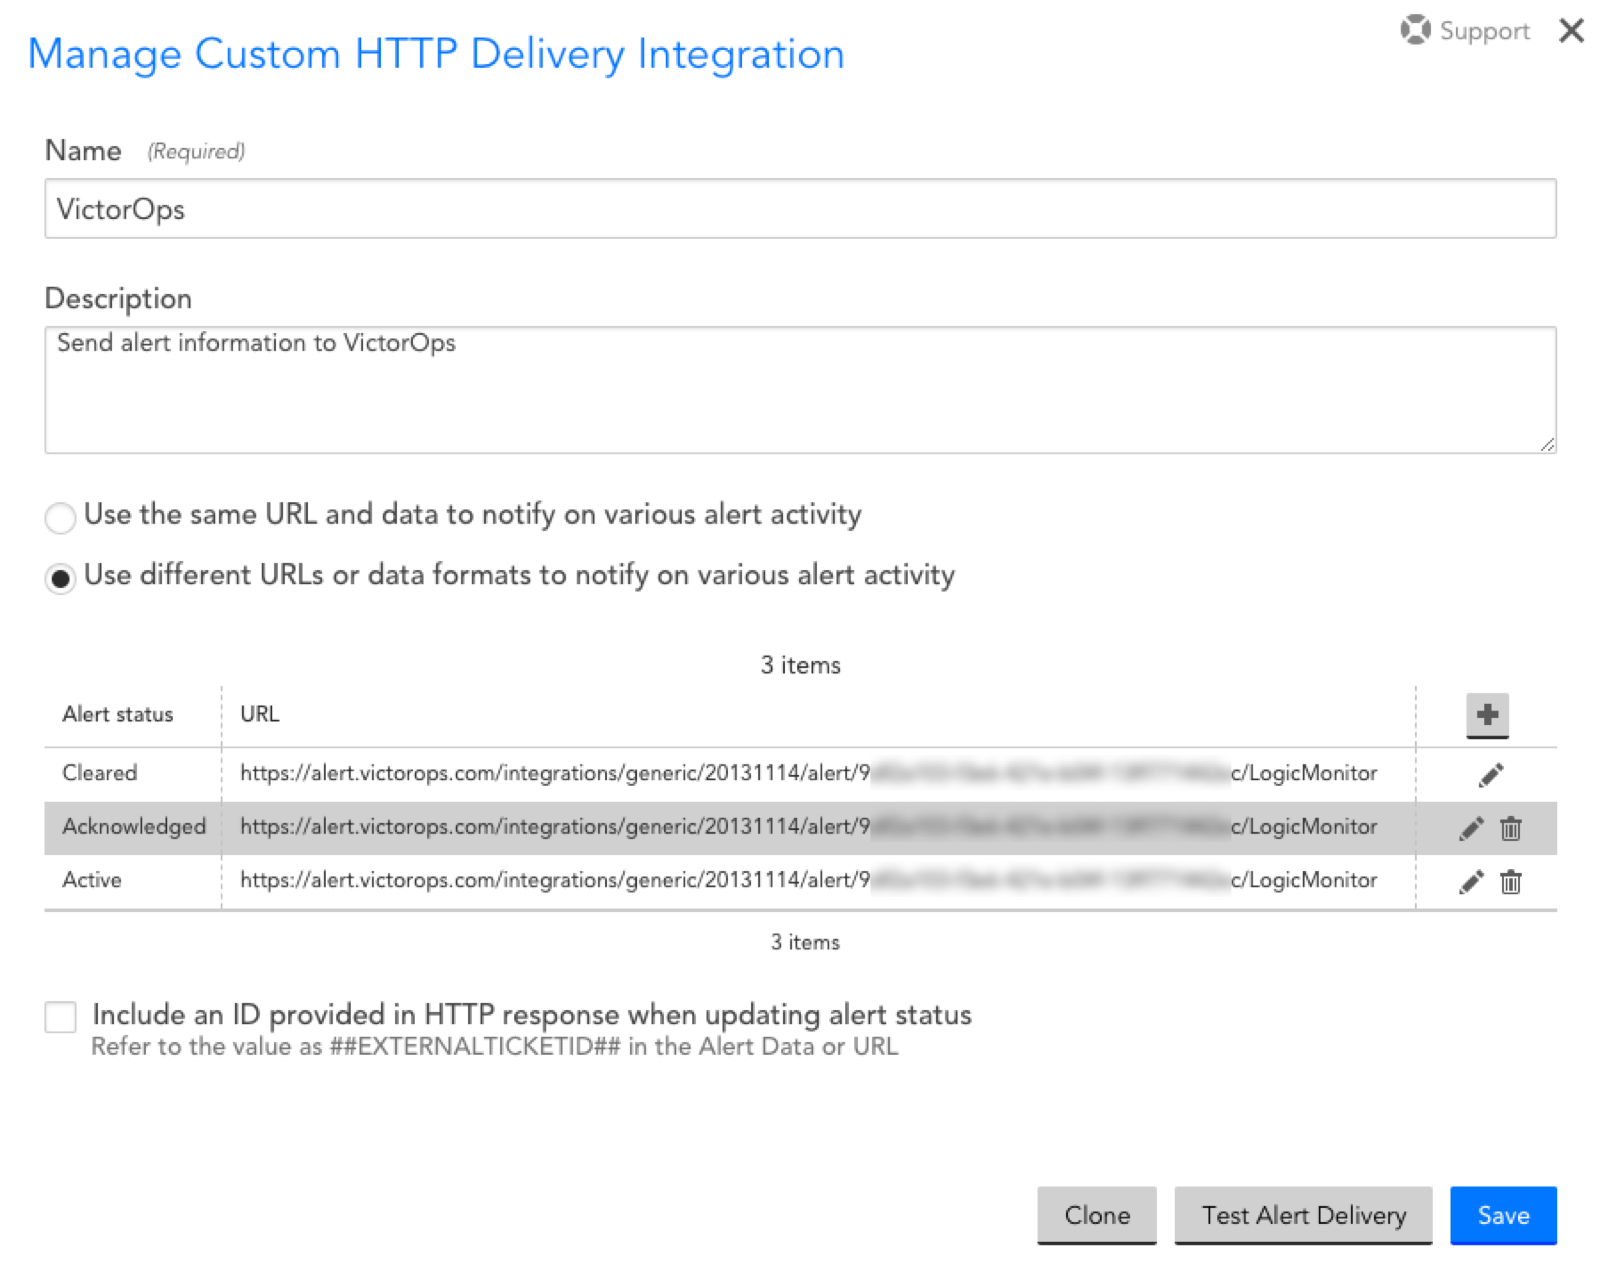
You will now need to create an alert method for each alert activity. Most of the configuration will be the same except for two settings: the alert activity and its corresponding message type defined in the post body. To do this, you will need to create separate configurations for each type of alert status.
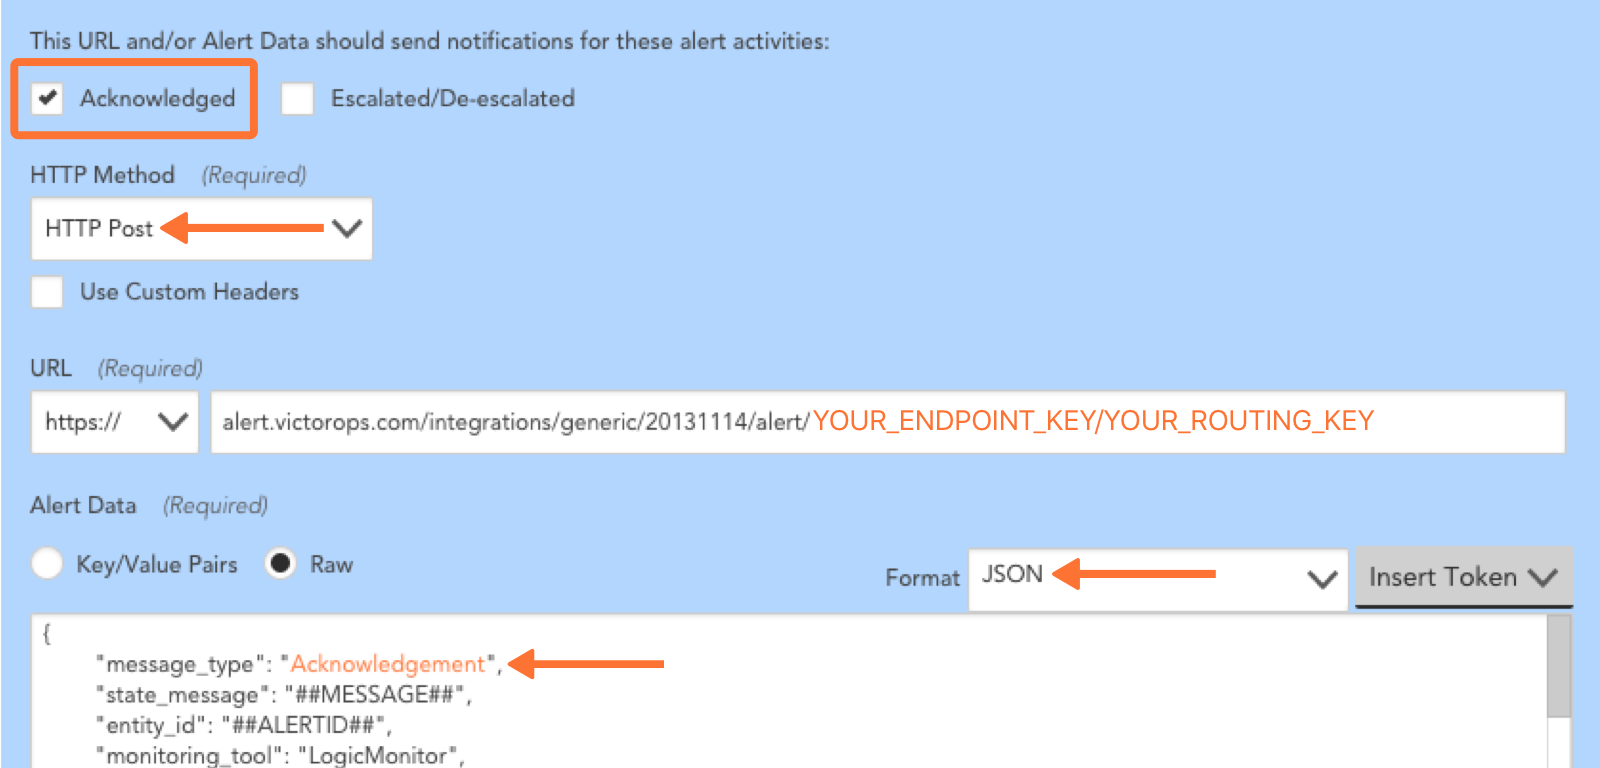
- HTTP Method: HTTP POST
- URL: https://alert.victorops.com/integrations/generic/20131114/alert/YOUR_API_KEY_HERE/YOUR_ROUTING_KEY_HERE
- Alert Data:
- Select Raw
- Format: JSON
- For the Alert Data paste the below message. Note that this sample assigns a value of CRITICAL to the message_type.
{
	"message_type":"CRITICAL",
	"state_message":"##MESSAGE##",
	"entity_id":"##ALERTID##",
	"monitoring_tool":"LogicMonitor",
	"entity_display_name":"##LEVEL## alert on ##HOST##",
	"GROUP":"##GROUP##",
	"START":"##START##",
	"DESCRIPTION":"##SERVICEDESCRIPTION##",
	"SERVICE_CHECKPOINT":"##CHECKPOINT##",
	"SERVICE_GROUP":"##SERVICEGROUP##",
	"CLIENT_URL":"https://##COMPANY##.logicmonitor.com",
	"ALERT_URL":"##AlertDetailURL##",
	"ADMIN":"##ADMIN##",
	"ALERTID":"##ALERTID##",
	"ALERTTYPE":"##ALERTTYPE##",
	"ALERTSTATUS":"##ALERTSTATUS##",
	"CMDLINE":"##CMDLINE##",
	"DATAPOINT":"##DATAPOINT##",
	"DATASOURCE":"##DATASOURCE##",
	"DPDESCRIPTION":"##DPDESCRIPTION##",
	"DSIDESCRIPTION":"##DSIDESCRIPTION##",
	"DURATION":"##DURATION##",
	"EVENTCODE":"##EVENTCODE##",
	"EXITCODE":"##EXITCODE##",
	"FACILITY":"##FACILITY##",
	"GENERALCODE":"##GENERALCODE##",
	"HOST":"##HOST##",
	"INSTANCE":"##INSTANCE##",
	"LEVEL":"##LEVEL##",
	"LOGFILE":"##LOGFILE##",
	"MESSAGE":"##MESSAGE##",
	"SOURCENAME":"##SOURCENAME##",
	"SPECIFICCODE":"##SPECIFICCODE##",
	"STARTEPOCH":"##STARTEPOCH##",
	"STDERR":"##STDERR##",
	"STDOUT":"##STDOUT##",
	"THRESHOLD":"##THRESHOLD##",
	"TRAPOID":"##TRAPOID##",
	"TYPE":"##TYPE##",
	"VALUE":"##VALUE##"
} |
Now, repeat steps one through four for an alert status of Acknowledged and again for Cleared. For each, within the Alert Data change the message_type field to reflect the alert status. Map the field as follows and refer to the screenshot for clarification:
| Alert Status | message_type |
|---|---|
| New Alerts |
CRITICAL |
| Acknowledged |
Acknowledgement |
| Cleared |
Recovery |
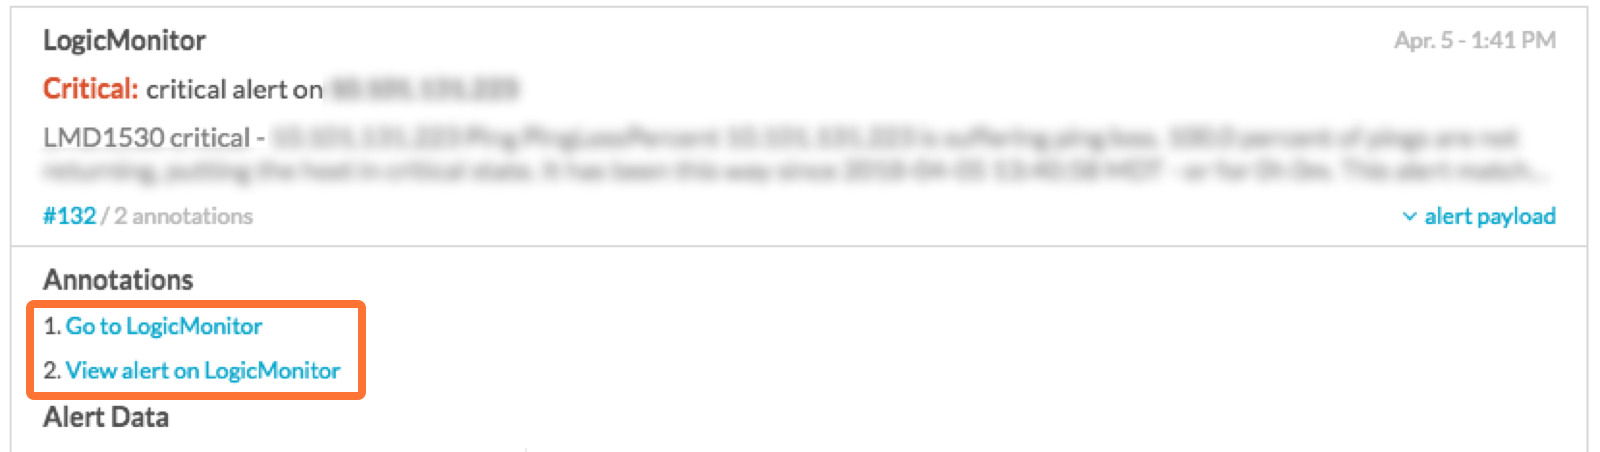
Add Annotations to Alerts
Note that this supplemental functionality leverages the Rules Engine which is a Full Stack feature.
Using the above configuration, the alert URL and client URL will be sent over as fields. In order to present these fields as highly accessible annotations, implement the following Rules Engine rules.
- When monitoring_tool matches LogicMonitor
Annotate the alert with:
- URL, View alert on LogicMonitor, ${{ALERT_URL}}
- URL, Go to LogicMonitor, ${{CLIENT_URL}}
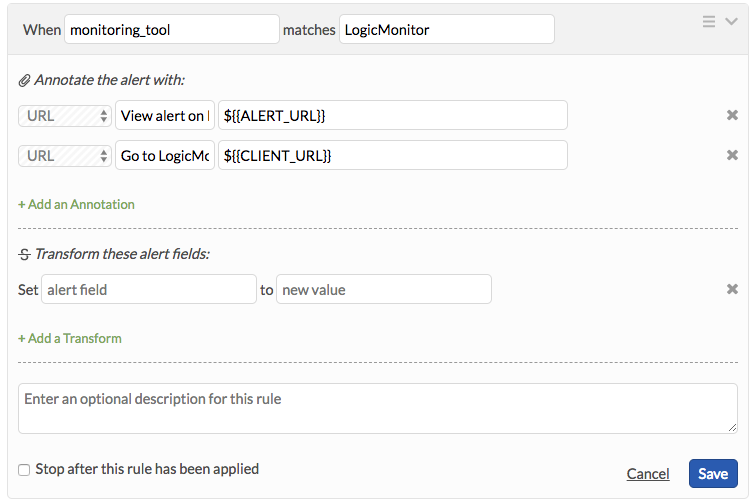
Once implemented, there will be direct links present in the incident and alert cards to both urls.