Versions Supported: N/A (SaaS)
VictorOps Version Required: Starter, Growth, or Enterprise
What you need to know: Annotating the links provided by DataDog to your incidents requires the use of the Rules Engine (Enterprise only feature)
Datadog is a monitoring service for IT, Operations and Development teams who write and run applications at scale and want to turn the massive amounts of data produced by their apps, tools, and services into actionable insight.
The Datadog integration with Splunk On-Call (formerly VictorOps), allows you to send content from Datadog into the timeline via @ mentions in the Datadog event stream. The following is a brief walkthrough on how to enable and configure the integration.
In Splunk On-Call
From the top navigation select Integrations >> 3rd Party Integrations >> DataDog. By clicking on the integration this will take you into the integration page.
If the integration has not yet been enabled, click the “Enable Integration” button. Copy the “Service API Key” to your clipboard.
In DataDog
Click “Integrations” in the sidebar menu, find the VictorOps integration, and click “Available” then “Install”.
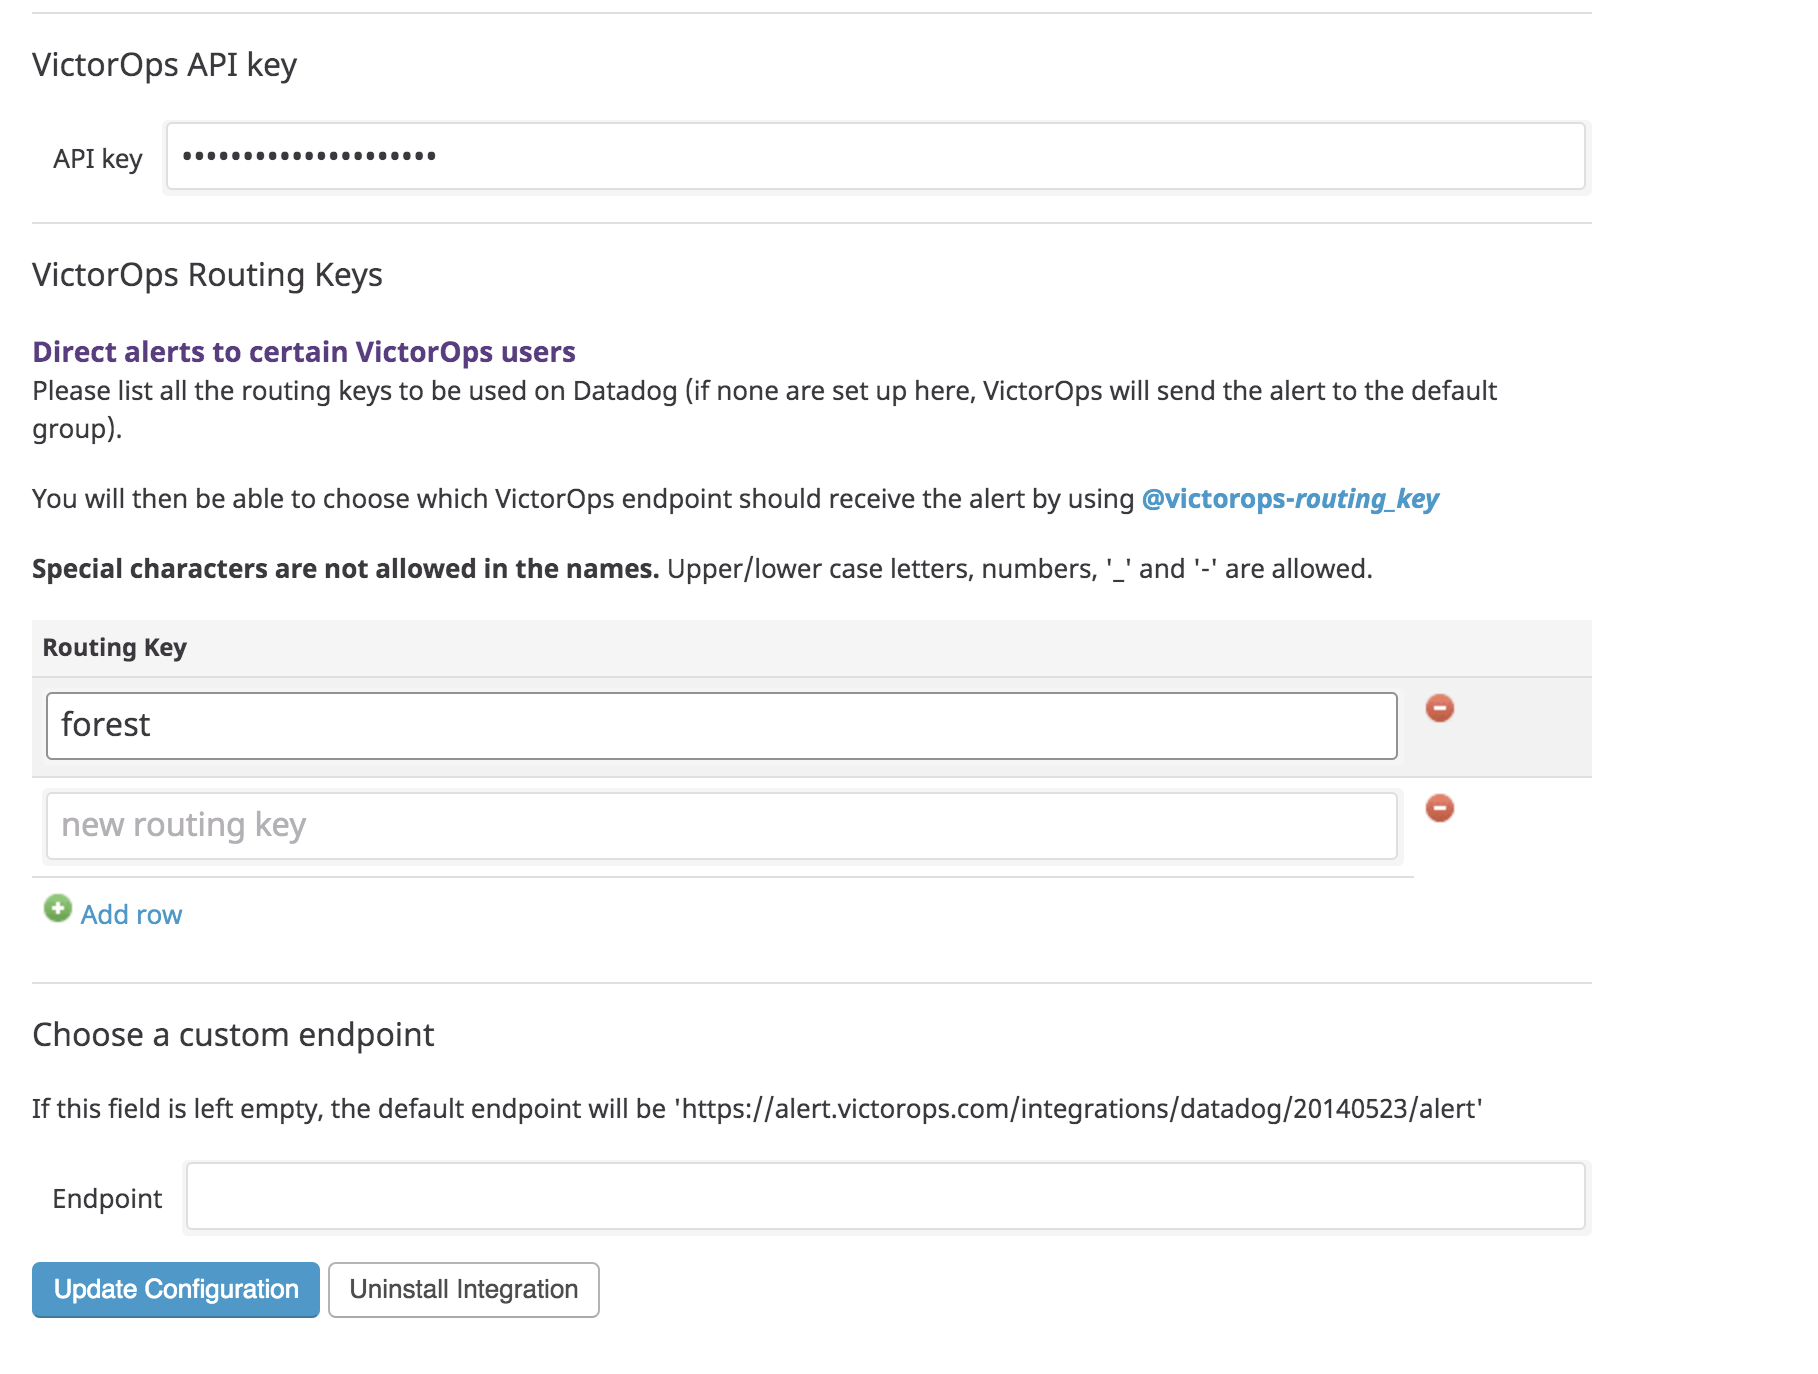
In the resulting modal, click the configuration tab. Here you will be able to paste in your VictorOps API Key as well as include the VictorOps routing key you wish to use. Once the VictorOps API Key and desired routing key has been added make sure to save the configuration.
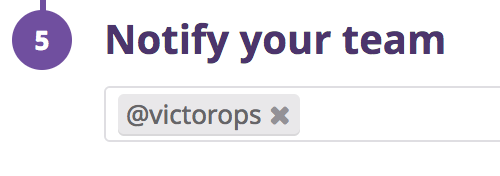
Finally, add @victorops- to your Datadog metric monitors. To ensure a monitor will auto-resolve the corresponding VictorOps incident, make sure that @victorops is selected in the monitor’s notification step.
Finally, check that VictorOps has installed properly and you’re done!
Resolve the DataDog Monitor from Splunk On-Call
(Custom Outgoing Webhooks and the Rules Engine are Enterprise level features only)
The best practice is to let Datadog, the source of the incident, resolve monitor incidents. However, if you would like to resolve the incident from Splunk On-Call, here is how to do it.
First, create a new Custom Outgoing Webhook. Navigate to Integrations >> Outgoing Webhooks and create a new webhook with the details below. Be sure to your specific Datadog API credentials to the end of the URL, as templated below.
- Event: Incident-Resolved
- Method: POST
- Content Type: application/json
- To: https://api.datadoghq.com/monitor/bulk_resolve?api_key=<dd_api_key>&application_key=<dd_app_key>
- Payload:
1 2 3 4 5 6 7 | { "resolve": [ { "${{ALERT.datadog_monitor_id}}": "ALL_GROUPS" } ] } |
Next, you must create an Alert Rules Engine rule to conditionally fire the above webhook. To do so, navigate to Settings >> Alert Rules Engine and create the following rule:
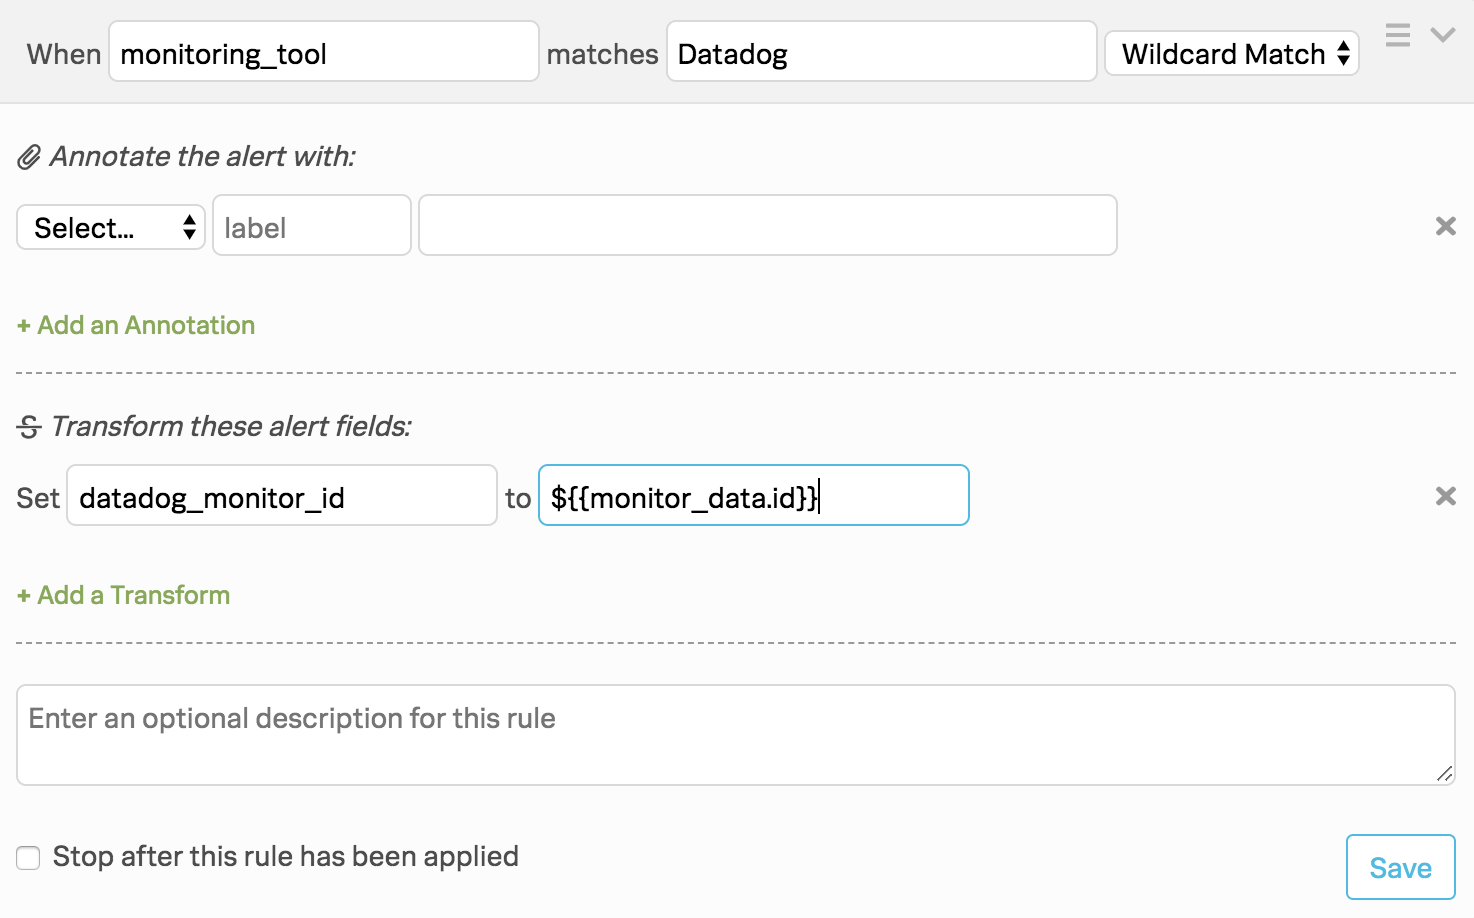
When monitoring_tool matches Datadog
- Transform:
- datadog_monitor_id : ${{monitor_data.id}}
Now, the custom outgoing webhook will be accurate when this rule is applied.
Recommended Alert Rules Engine Rule
(The Splunk On-Call Alert Rules Engine is an Enterprise level feature only)
Datadog alerts typically include useful links that can be annotated to your alerts to automatically render snapshot images and provide quick links to the Datadog UI. We recommend the following Rules Engine annotations, which can either independent or be added to the rule created previously:
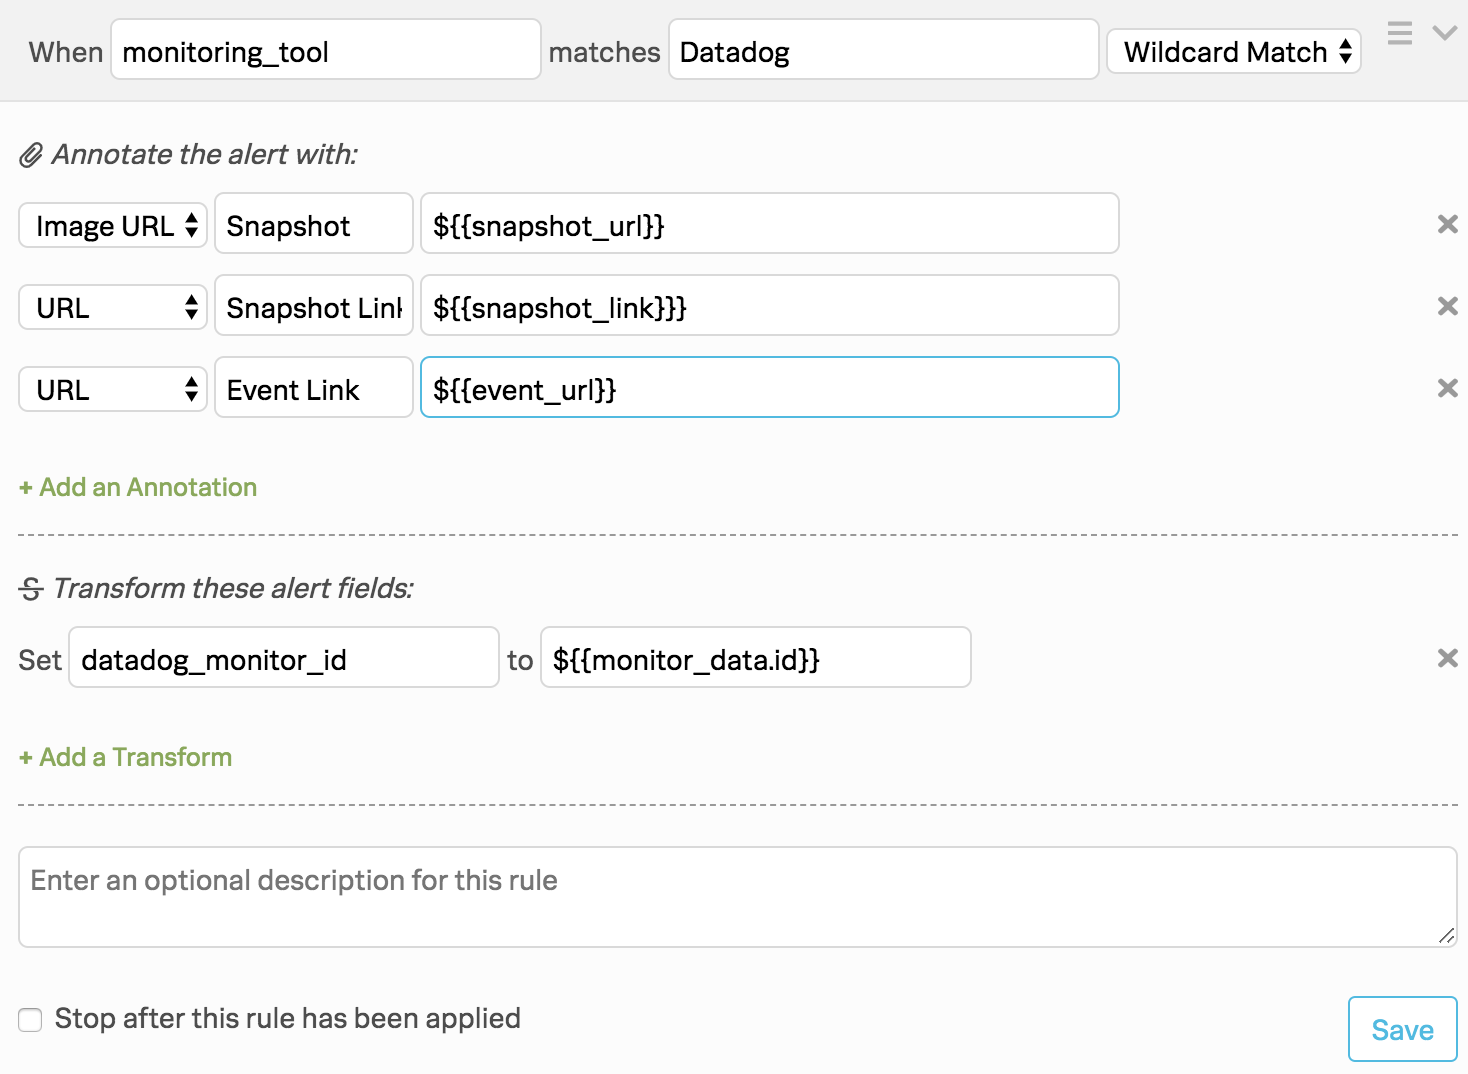
When monitoring_tool matches Datadog
- Annotations:
- Image URL : Snapshot : ${{snapshot_url}} – Renders snapshot image in the VictorOps timeline
- URL : Snapshot Link: ${{snapshot_link}}} – Provides clickable link to image in Datadog
- URL : Event Link: E – Provides a clickable link to the event in the Datadog UI