About Splunk On-Call and Grafana
The Splunk On-Call and Grafana integration allows you to forward Grafana alerts and dashboards into Splunk On-Call to notify the correct on-call users. Create on-call schedules, rotations, and escalation policies in Splunk On-Call, then route Grafana alerts and charts based on those parameters. Monitor and visualize logs, metrics and traces in Grafana and set thresholds to optimize alerts, create charts and surface actionable system insights.
When events meet predetermined monitoring criteria, Grafana sends an alert notification. Then, in the Splunk On-Call timeline, users can route and escalate critical alert data to the correct people. With the Splunk On-Call and Grafana integration, on-call responders can collaborate in real-time around system data to reduce MTTA/MTTR and resolve incidents faster.
Optimize Alerts and Incident Visibility throughout the Entire Organization
- Track system performance over time, visualize service health and alert on-call teams when applicable monitoring thresholds are met
- Surface alert context in the form of metrics, logs, graphs and links to runbooks
- Automatically route and escalate Grafana alert data through Splunk On-Call software and collaborate in a single-pane-of-glass to drive incident workflows forward
- Chat in-line with incident context to improve collaboration and quickly share critical infrastructure information and dashboards, reducing MTTA/MTTR
Grafana is a general purpose dashboard and graph composer. It’s focused on providing rich ways to visualize time series metrics from Graphite, but also works with several other popular metric databases like InfluxDB, OpenTSDB, and Prometheus. The Grafana and Splunk On-Call integration allows you to understand your alerts and metrics so you get the most out of your data. The following guide will walk you through this easy to implement integration.
Enable Grafana in Splunk On-Call
From the main timeline navigate to Integrations >> Grafana
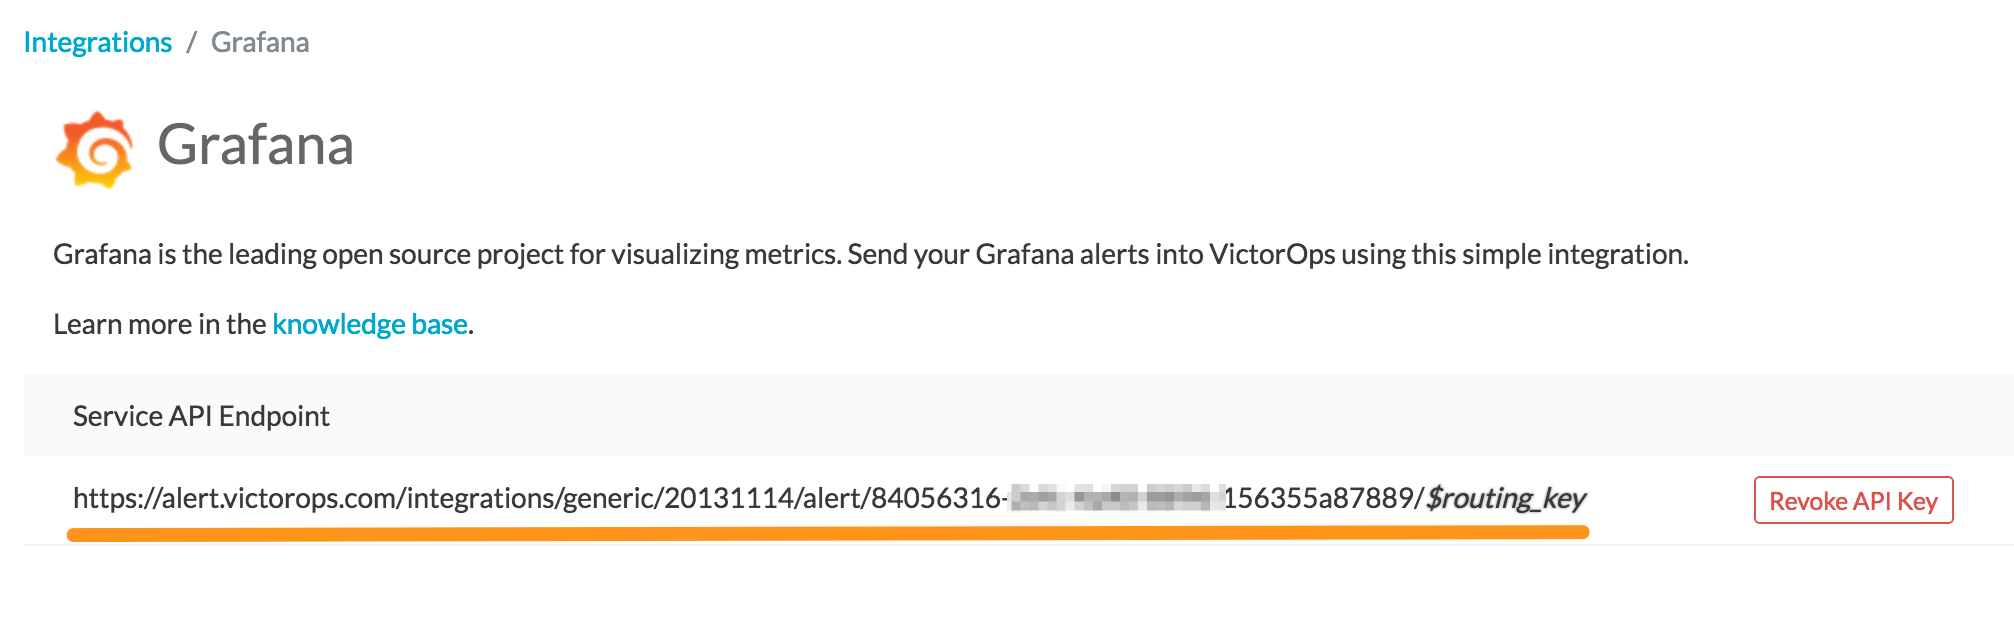
Select the Grafana integration and copy the Service API Endpoint to your clipboard.
Connect Splunk On-Call in Grafana
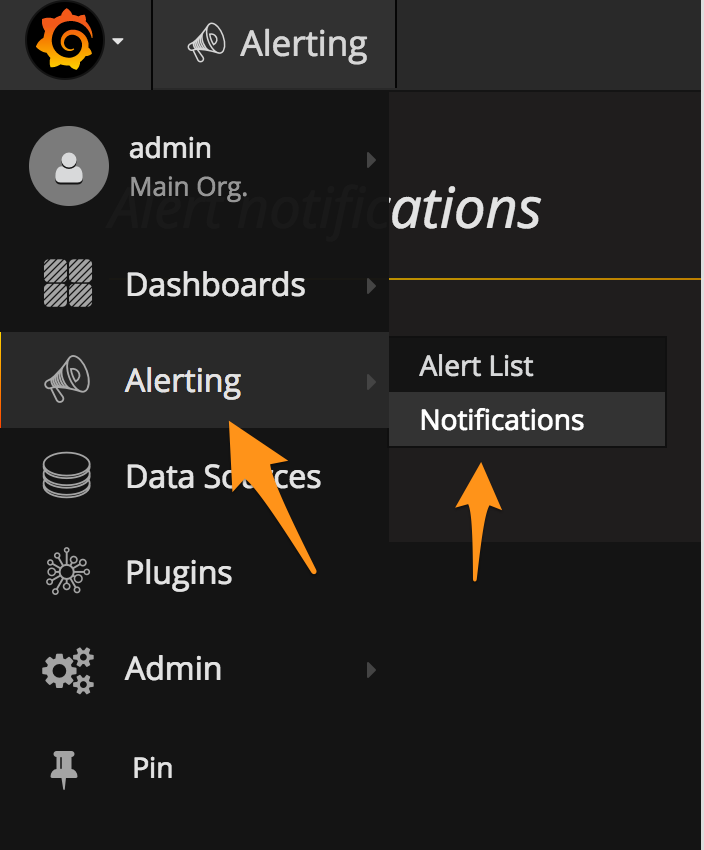
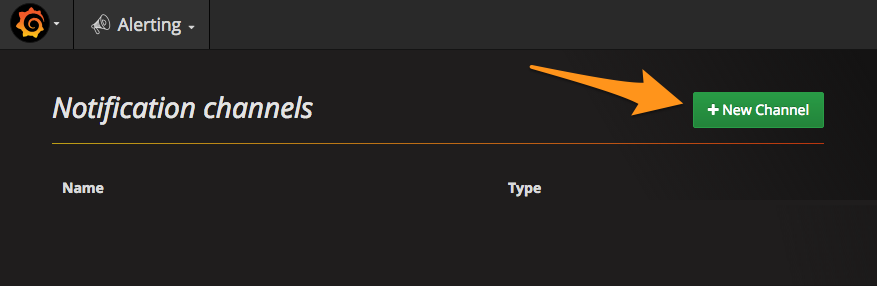
From the main dashboard, select the options menu then Alerting then Notification Channels.
Add a New Channel.
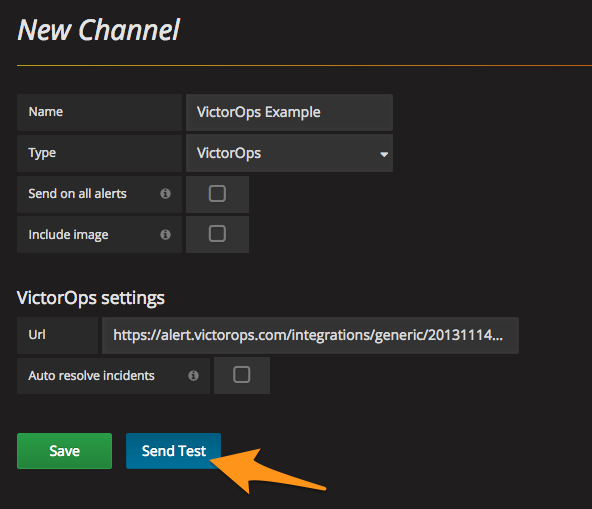
Give the notification a name select the VictorOps type. In the VictorOps settings paste in your Service API Endpoint from your clipboard. Be sure to replace the “$routing_key” section with the actual routing key you intend to use. (For more information on setting up routing keys, see our Knowledge Base article on Routing Keys)
You can now test and save the integration.
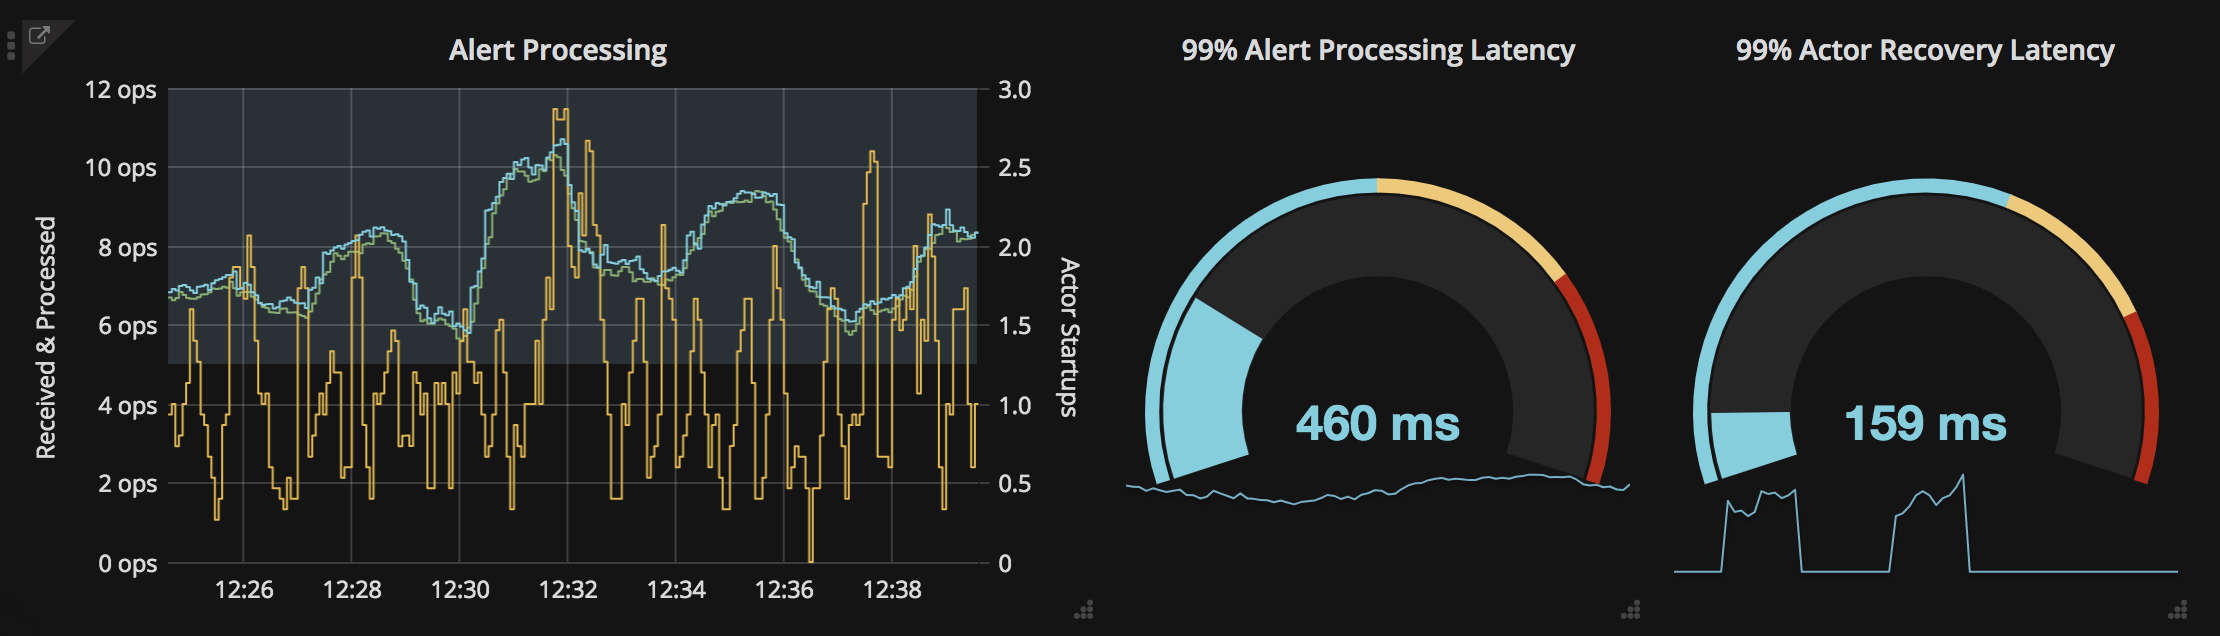
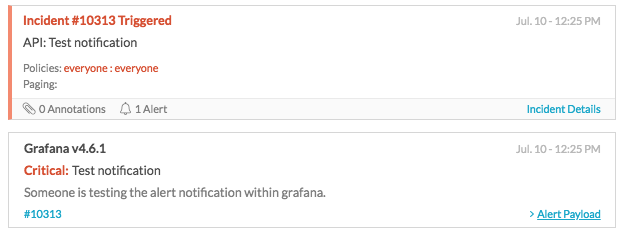
The resulting test alert in Splunk On-Call should look similar to this:
Connect the Notification Channel to your Alert
Locate the Grafana Dashboard panel you want to send alerts to Splunk On-Call and click on the Edit button. This should appear by clicking on the dropdown arrow next to the panel’s name. Next, navigate to the Alert section on the lefthand side. Define your alert conditions and then under Notifications, click the plus button to select the notification channel you just configured.
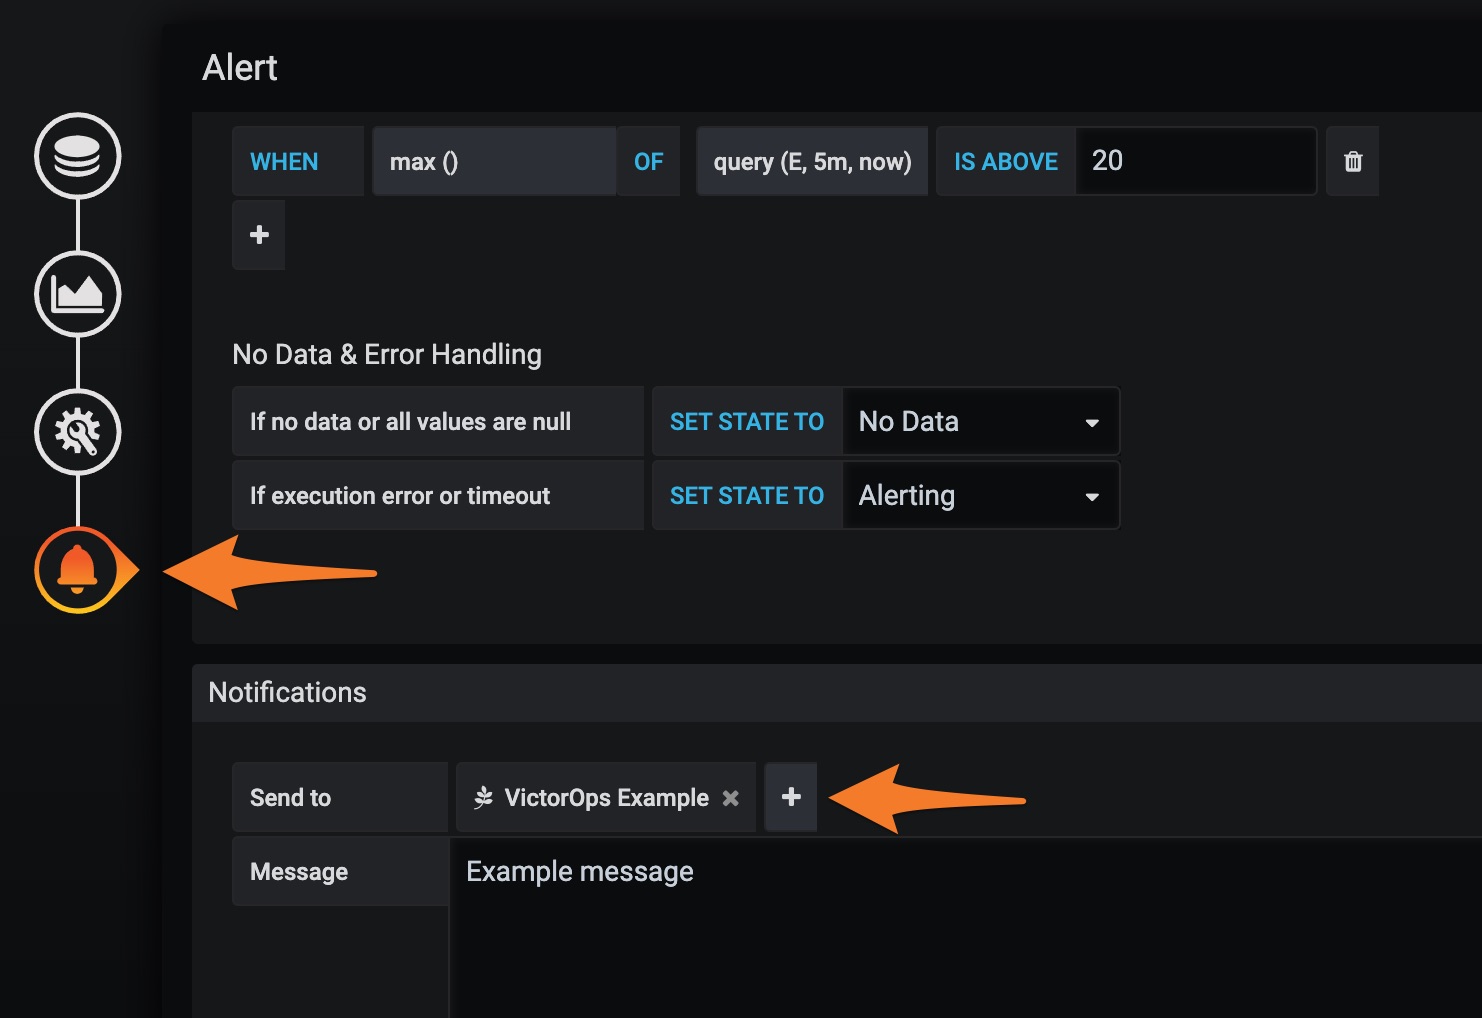
Be sure to save your changes. The standard configuration is now complete.
Repeat these steps as necessary, creating separate Notification Channels for each Routing Key you’d like utilized and assigning the Notification Channel on each Dashboard Panel you’d like to alert you.
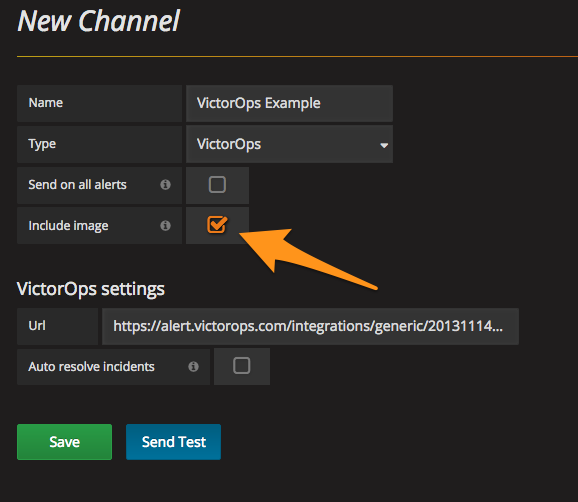
Include an Image on the Alert
For those with Enterprise Splunk On-Call features, you can include the Grafana image of the alert in the notification. When configuring the notification channel in Grafana, select the box to Include image.
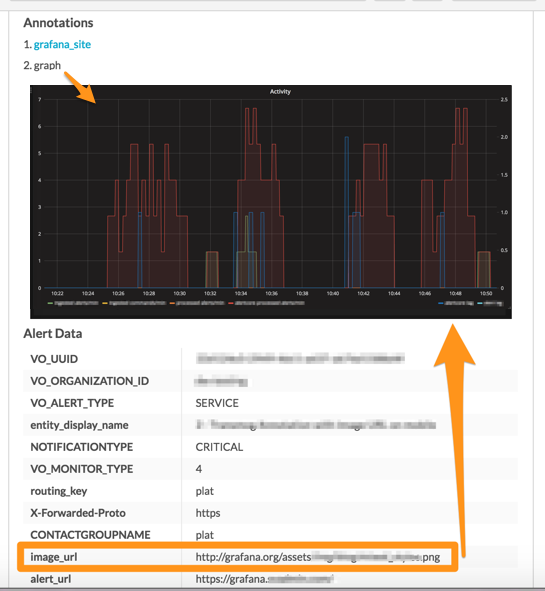
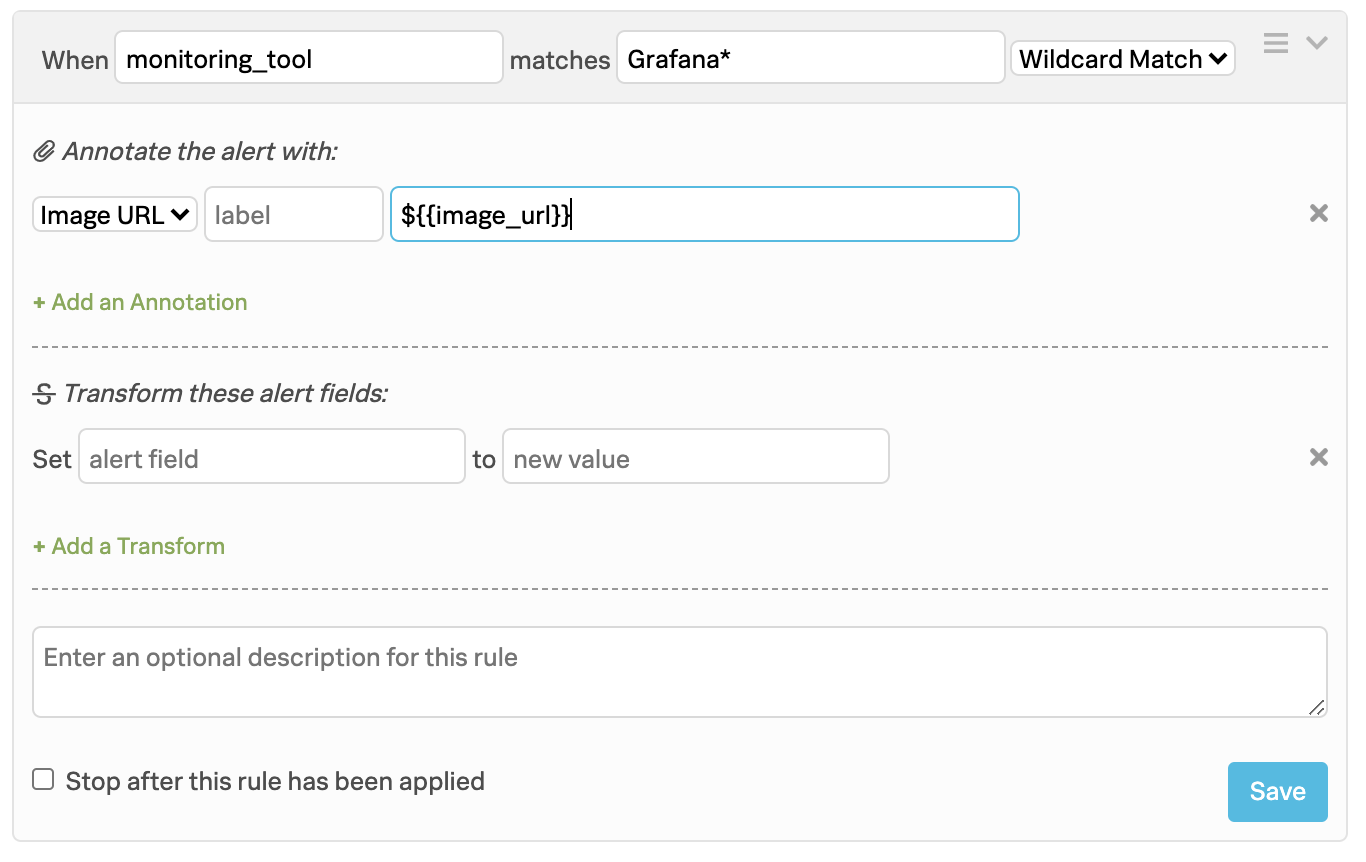
In Splunk On-Call, add the following Rules Engine rule that will surface the image_url as an annotation to the incident. (Found by navigating to Settings >> Alert Rules Engine)
Lastly, ensure that the image is hosted in a publicly accessible location so that Splunk On-Call can display it. For further information, please reference the Enable images in notification section of this Grafana article.
Your resulting Splunk On-Call incident should now include the image as an annotation: